This site uses cookies to improve your experience. To help us insure we adhere to various privacy regulations, please select your country/region of residence. If you do not select a country, we will assume you are from the United States. Select your Cookie Settings or view our Privacy Policy and Terms of Use.
Cookie Settings
Cookies and similar technologies are used on this website for proper function of the website, for tracking performance analytics and for marketing purposes. We and some of our third-party providers may use cookie data for various purposes. Please review the cookie settings below and choose your preference.
Used for the proper function of the website
Used for monitoring website traffic and interactions
Cookie Settings
Cookies and similar technologies are used on this website for proper function of the website, for tracking performance analytics and for marketing purposes. We and some of our third-party providers may use cookie data for various purposes. Please review the cookie settings below and choose your preference.
Strictly Necessary: Used for the proper function of the website
Performance/Analytics: Used for monitoring website traffic and interactions
The headline jobs number in the December employment report was well above expectations, however, October and November payrolls were revised down by 8,000 combined. Part Time for Economic Reasons From the BLS report : " The number of people employed part time for economic reasons, at 4.4 YoY in March 2022 and was at 3.9%
The headline jobs number in the January employment report was below expectations, however, November and December payrolls were revised up by 100,000 combined. Part Time for Economic Reasons From the BLS report : " The number of people employed part time for economic reasons, at 4.5 million, changed little in January.
The headline jobs number in the February employment report was slightly below expectations, and December and January payrolls were revised down by 2,000 combined. Part Time for Economic Reasons From the BLS report : " The number of people employed part time for economic reasons increased by 460,000 to 4.9 million from 4.48
The headline jobs number in the April employment report was below expectations, and February and March payrolls were revised down by 22,000 combined. Part Time for Economic Reasons From the BLS report : " The number of people employed part time for economic reasons, at 4.5 million, changed little in April. million from 4.31
The headline jobs number in the May employment report was well above expectations, however March and April payrolls were revised down by 15,000 combined. Part Time for Economic Reasons From the BLS report : " The number of people employed part time for economic reasons, at 4.4 million, changed little in May.
The headline jobs number in the March employment report was above expectations; and January and February payrolls were revised up by 22,000 combined. Part Time for Economic Reasons From the BLS report : " The number of people employed part time for economic reasons, at 4.3 million, changed little in March. million from 4.36
The headline jobs number in the July employment report was below expectations, and May and June payrolls were revised down by 29,000 combined. Part Time for Economic Reasons From the BLS report : " The number of people employed part time for economic reasons rose by 346,000 to 4.6 million in July. million from 4.22
The headline jobs number in the September employment report was well above expectations, and July and August payrolls were revised up by 72,000 combined. Part Time for Economic Reasons From the BLS report : " The number of people employed part time for economic reasons changed little at 4.6 YoY in September.
Meaning, you do not get the 8-10% long-term gains without living through a significant number of market events, ranging from cyclical drawdowns to longer secular bear markets, and full-on crashes. 2000-13 : Secular bear market did not make new highs until March 2013 2018 : ~20% pullback as the economy slowed, FOMC hiked.
The headline jobs number in the September employment report was well above expectations, and employment for the previous two months was revised up by 119,000, combined. Part Time for Economic Reasons From the BLS report : " The number of persons employed part time for economic reasons, at 4.1 million from 4.22
The headline jobs number in the August employment report was below expectations, and June and July payrolls were revised down by 82,000 combined. Part Time for Economic Reasons From the BLS report : " The number of people employed part time for economic reasons was little changed at 4.8 YoY in March 2022 and was at 3.8%
From Dodge Data Analytics: Dodge Momentum Index Continues to Climb in October he Dodge Momentum Index (DMI), issued by Dodge Construction Network, improved 9.6% (2000=100) in October to 199.7 from the revised September reading of 182.2. Commercial planning was bolstered by a solid increase in office and hotel projects.
The headline jobs number in the October employment report was below expectations, and employment for the previous two months was revised down by 101,000, combined. Part Time for Economic Reasons From the BLS report : " The number of persons employed part time for economic reasons, at 4.3 million from 4.07 million from 4.07
The headline jobs number in the November employment report was at expectations, however employment for the previous two months was revised down by 35,000, combined. Part Time for Economic Reasons From the BLS report : " The number of persons employed part time for economic reasons decreased by 295,000 to 4.0
The headline jobs number in the December employment report was above expectations, however employment for the previous two months was revised down by 71,000, combined. Part Time for Economic Reasons From the BLS report : " The number of persons employed part time for economic reasons, at 4.2 YoY in December.
Earlier I posted some questions on my blog for next year: Ten Economic Questions for 2023. A large portion of the decline in the participation rate since 2000 was due to demographics and long-term trends. I'm adding some thoughts, and maybe some predictions for each question. in February 2020, and up from the pandemic low of 60.1%
The headline jobs number in the June employment report was above expectations, however April and May payrolls were revised down by 111,000 combined. Part Time for Economic Reasons From the BLS report : " The number of people employed part time for economic reasons, at 4.2 million, changed little in June. million from 4.42
The headline jobs number in the January employment report was well above expectations, and November and December payrolls were revised up by 126,000 combined. Part Time for Economic Reasons From the BLS report : " In January, the number of people employed part time for economic reasons, at 4.4 Including revisions: The 3.06
The headline jobs number in the February employment report was above expectations; however, December and January payrolls were revised down by 167,000 combined. Part Time for Economic Reasons From the BLS report : " The number of people employed part time for economic reasons, at 4.4 million, changed little in February.
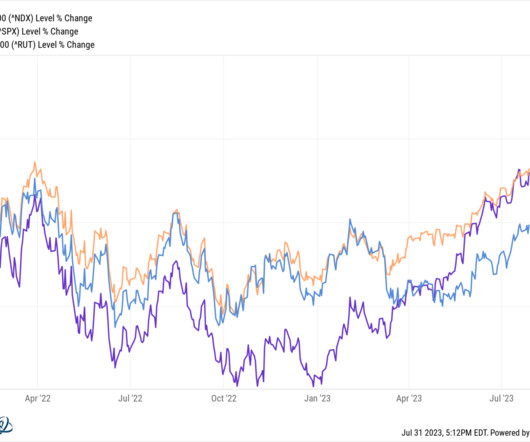
but the giveback off the highs was substantial: S&P 500 was down ~23%, Russell 2000 was off 27%, and the Nasdaq 100 came down 32%. Recall John Kenneth Galbraith’s observation: “The only function of economic forecasting is to make astrology look respectable.” Blame whatever you want – Too far, too fast? End of ZIRP?
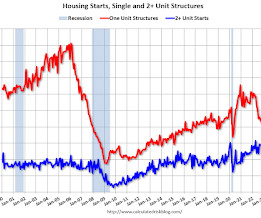
For manufacturing, April Industrial Production, and the May NY and Philly Fed manufacturing surveys will be released. -- Monday, May 13th -- No major economic releases scheduled. -- Tuesday, May 14th -- 6:00 AM ET: NFIB Small Business Optimism Index for April. This graph shows single and total housing starts since 2000. up from -14.3.
2000=100) from the revised June reading of 195.1. July also saw a deceleration in the number of education and healthcare projects entering planning — the two largest institutional segments. Commercial construction is a lagging economic indicator. in July to 193.4 emphasis added Click on graph for larger image.
The Russell 2000, an index of 2,000 small-cap companies widely used as a benchmark for U.S. 7 This Week: Key Economic Data Tuesday: Consumer Confidence. Source: I nvestors Business Daily – Econoday economic calendar ; November 21, 2024 The Econoday economic calendar lists upcoming U.S. small-cap stocks, rose 4.50
Schroders ) • The Exact Age When You Make Your Best Financial Decisions There’s a magic number for when your expertise and cognitive powers align. The leading economic indicators show the U.S. 2000-2003 Dotcom implosion 6. Savings rates have rocketed and UK savers can earn over 5% on deposits. With the 10 year at 4.2%
last week, declining for the second consecutive week, but there’s still a lot of strength under the surface, as the small cap Russell 2000 Index climbed 3.5%. March 2000 at the peak of the tech bubble. Q2 GDP Growth Confirms Economic Resilience The economy grew at an annualized pace of 2.8% The S&P 500 fell 0.8%
Other than 2000 and 2020 there is not much lead time between the time industrial production peaks and recession starts. The current numbers by themselves do not indicate much of anything but they are one of the items the NBER will use in arrears to determine if a recession has started. The chart is through October.
Weekly Market Insights | December 2nd, 2024 Solid Gains for Thanksgiving Week Stocks posted solid gains over a short and busy holiday week as investors parsed fresh economic data, comments on potential future trade policy, and a few Q3 reports from technology companies. One area of concern has been the economic impact of proposed tariffs.
This graph shows the year-over-year change in the seasonally adjusted National Index, Composite 10 and Composite 20 indexes through the most recent report (the Composite 20 was started in January 2000). The number of job openings (black) were down 20% year-over-year. 9:00 AM: FHFA House Price Index for March 2022. million from 10.0
suicide rates are up some 40% since 2000. brookings.edu) States are providing free college educations to increase the number of trained teachers. abnormalreturns.com) Podcast links: the economics of innovation (abnormalreturns.com) Are you a financial adviser looking for some out-of-the-box thinking? wired.com) However, U.S.
And, and I kind of raised my hand and said, dad, uncle John, don’t you think it might be a better idea to look at it by the numbers? So, the reason I am an economics, I have a degree in economics. The reason for that was I had maybe six more credits, four to six more credits in economics than I had in history.
Coming off the blowout jobs report and the debt ceiling agreement, last week was a slower week for economic data. Given the Fed’s guidance, we expect them to hold rates unchanged on Wednesday, but retain a hawkish bias which opens the door to a July rate hike if economic activity and namely inflation do not cool sufficiently.
A Glimpse into the Past: The Historical Giants In order to understand the potential growth trajectory to a $10 trillion company, we must first examine the economic giants of the past. In 2000, General Electric accounted for over 5% of the S&P 500 ( source ). In 2000, the total value of the US stock market was $15.1
Here we shall discuss the most traded commodities in the world with their importance, impact on economics and factors affecting their prices globally. The price of Brent crude oil depends on supply and demand factors where the demand for crude oil is linked with global economic performance.
Monthly numbers can be noisy and so a 3-month average is helpful. The hiring rate, which is the number of hires as a percent of the labor force, has fallen to 3.3%, the slowest pace since 2013 (outside of the Covid months). The economy created 256,000 jobs in December, blowing past expectations for a 165,000 increase.
Now, this wonderful section in this little bitty book that I’ve just finished, wonderful section on behavioral economics, terrific book by Daniel Kahneman, thinking Fast, thinking Slow. 00:27:54 [Speaker Changed] Let’s put some, some numbers, some mean on that bone. 00:46:08 So it does have an economic value.
Barry Ritholtz : The the funny thing is, the behavioral aspect of mutual funds seems to have been when people finally learn about a manager who’s put up great numbers, by the time it makes to make makes it to Forbes, hey, most of that run is probably over and a little mean reversion is about to kick in. I did it in 2000, 2002.
What makes Graham so interesting is while everybody else in the world of private equity is focused on the analytics and crunching numbers and creating econometric models that will tell you where to invest, I think they’ve found a very different model that has been extremely successful for them, where the key focus is on talent.
Those numbers were the underpinning of a large upside surprise in July retail sales. Given the somewhat gloomy economic expectations still baked into the market following the weaker-than-expected August 2 jobs report, the market response was decisively positive. Headline retail sales came in at 1.0% versus a 0.2% consensus expectation.
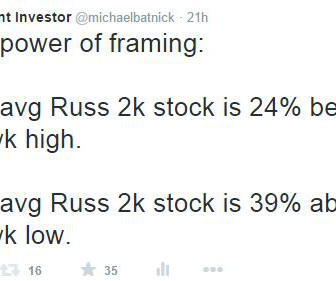
Daniel Kahneman, one of the pioneers of behavioral economics, describes framing in his Thinking, Fast and Slow : "Framing effects: Different ways of presenting the same information often evoke different emotions. However, by the nature of where these prices are anchored to, the numbers are pretty misleading.
They cited various factors, including rising inflation, geopolitical tensions, and lingering effects of the pandemic, as harbingers of an impending economic downturn. Economic indicators have displayed some resilience and even showed signs of strength in certain sectors.
For example, if the house brings in $2000 per month ($24,000 each year) and the sale price is $240,000, the next investor is buying a business with a price-to-earnings ratio of 10, because 240k/24k=10. This year they came up with these numbers: Vanguards updated 10-year annualized return projections: Global bonds, non-U.S.:
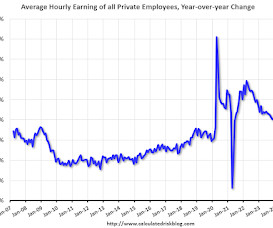
Despite the strong 311,000 gain in net new jobs in February, the average number of hours worked by employees fell a 0.1 Despite the strong 311,000 gain in net new jobs in February, the average number of hours worked by employees fell a 0.1 The decline in unit auto sales on the month should weigh on the headline reading.
Wall Streeters give a lot of credence to economic forecasts at the start of every year, as corporations project demand and craft their budgets and money managers plan out their strategies for the next year. for 2020 while the real number was -2.8%. Some years saw a bigger discrepancy; in 2019, the median prediction was 1.8%
Beyond headline inflation, higher energy prices can even feed into core inflation numbers that the Fed typically focuses on. And if economic growth remains resilient, bond yields should not be moving lower. But mid- and small-cap stocks, which are even more geared to economic growth, outperformed.
We organize all of the trending information in your field so you don't have to. Join 36,000+ users and stay up to date on the latest articles your peers are reading.
You know about us, now we want to get to know you!
Let's personalize your content
Let's get even more personalized
We recognize your account from another site in our network, please click 'Send Email' below to continue with verifying your account and setting a password.


Let's personalize your content