This site uses cookies to improve your experience. To help us insure we adhere to various privacy regulations, please select your country/region of residence. If you do not select a country, we will assume you are from the United States. Select your Cookie Settings or view our Privacy Policy and Terms of Use.
Cookie Settings
Cookies and similar technologies are used on this website for proper function of the website, for tracking performance analytics and for marketing purposes. We and some of our third-party providers may use cookie data for various purposes. Please review the cookie settings below and choose your preference.
Used for the proper function of the website
Used for monitoring website traffic and interactions
Cookie Settings
Cookies and similar technologies are used on this website for proper function of the website, for tracking performance analytics and for marketing purposes. We and some of our third-party providers may use cookie data for various purposes. Please review the cookie settings below and choose your preference.
Strictly Necessary: Used for the proper function of the website
Performance/Analytics: Used for monitoring website traffic and interactions
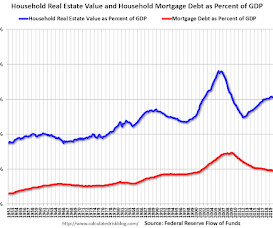
This includes real estate and financial assets (stocks, bonds, pension reserves, deposits, etc.) Household percent equity (as measured by the Fed) collapsed when house prices fell sharply in 2007 and 2008. The third graph shows household real estate assets and mortgage debt as a percent of GDP. in Q3, 2024. in Q3, 2024.
This includes real estate and financial assets (stocks, bonds, pension reserves, deposits, etc.) Household percent equity (as measured by the Fed) collapsed when house prices fell sharply in 2007 and 2008. The third graph shows household real estate assets and mortgage debt as a percent of GDP. in Q1, 2024. in Q1, 2024.
This includes real estate and financial assets (stocks, bonds, pension reserves, deposits, etc) net of liabilities (mostly mortgages). Household percent equity (as measured by the Fed) collapsed when house prices fell sharply in 2007 and 2008. The third graph shows household real estate assets and mortgage debt as a percent of GDP.
This includes real estate and financial assets (stocks, bonds, pension reserves, deposits, etc) net of liabilities (mostly mortgages). Household percent equity (as measured by the Fed) collapsed when house prices fell sharply in 2007 and 2008. The third graph shows household real estate assets and mortgage debt as a percent of GDP.
Salisbury , chief investment officer of asset and wealth management at Goldman Sachs. He is also a member of the management committee, and Co-Chairs the Asset Management Investment Committees, which includes private equity, infrastructure, growth equity, credit, and real estate. This week, we speak with Julian C.
This includes real estate and financial assets (stocks, bonds, pension reserves, deposits, etc) net of liabilities (mostly mortgages). Household percent equity (as measured by the Fed) collapsed when house prices fell sharply in 2007 and 2008. The third graph shows household real estate assets and mortgage debt as a percent of GDP.
The S&P 500 topped out in early October 2007 and bottomed in March 2009. On a price-only basis, the index didn’t reach those 2007 highs again until March 2013: ( Wealth of Common Sense ). • Like many things in the market, there aren’t any hard and fast rules for this kind of thing, especially in real-time.
This includes real estate and financial assets (stocks, bonds, pension reserves, deposits, etc) net of liabilities (mostly mortgages). Household percent equity (as measured by the Fed) collapsed when house prices fell sharply in 2007 and 2008. The third graph shows household real estate assets and mortgage debt as a percent of GDP.
This includes real estate and financial assets (stocks, bonds, pension reserves, deposits, etc) net of liabilities (mostly mortgages). Household percent equity (as measured by the Fed) collapsed when house prices fell sharply in 2007 and 2008. The third graph shows household real estate assets and mortgage debt as a percent of GDP.
This includes real estate and financial assets (stocks, bonds, pension reserves, deposits, etc.) Household percent equity (as measured by the Fed) collapsed when house prices fell sharply in 2007 and 2008. The third graph shows household real estate assets and mortgage debt as a percent of GDP. in Q4, 2023. in Q4, 2023.
This includes real estate and financial assets (stocks, bonds, pension reserves, deposits, etc.) Household percent equity (as measured by the Fed) collapsed when house prices fell sharply in 2007 and 2008. The third graph shows household real estate assets and mortgage debt as a percent of GDP. in Q3, 2023. in Q3, 2023.
He was the director of systematic investing at Bear Stearns, leaving in 2007 to launch O’Shaughnessy Asset Management, now a part of Franklin Templeton. We discuss how the book What Works on Wall Street set the tone for his entire career as a quant.
This includes real estate and financial assets (stocks, bonds, pension reserves, deposits, etc.) Household percent equity (as measured by the Fed) collapsed when house prices fell sharply in 2007 and 2008. The third graph shows household real estate assets and mortgage debt as a percent of GDP. in Q2, 2023. in Q2, 2023.
Equity markets corrected by more than 50% in 2000-01 and more than 60% in 2007-08 which lasted for 1.5-3 Like the circle of life, good times are followed by bad times, and bad times are followed by good times, stock markets also go through cycles of excessive greed/optimism to excessive fear/pessimism.
By then, we began to have meaningful assets in our savings/retirement accounts and the bear markets had a bigger economic impact on those finances. 2000-13 : Secular bear market did not make new highs until March 2013 2018 : ~20% pullback as the economy slowed, FOMC hiked.
Low Stakes : The most successful market timers are often those people who do not have actual assets at risk. The dotcom top, the double bottom in Oct 02-March 03; the highs in 2007, the lows 2009. Catching the exact right moment when the crowd is mostly wrong goes against all of your instincts as a social primate.3
This includes real estate and financial assets (stocks, bonds, pension reserves, deposits, etc.) Household percent equity (as measured by the Fed) collapsed when house prices fell sharply in 2007 and 2008. The third graph shows household real estate assets and mortgage debt as a percent of GDP. in Q2, 2024. in Q2, 2024.
It previously offered asset financing and advisory services. The company formed Ladderup Corporate Advisory in 2007 and expanded into wealth management in 2008, followed by insurance broking in 2010. With a market capitalization of Rs. crores, Kothari Industrial Corporation Limited’s share price closed at Rs.
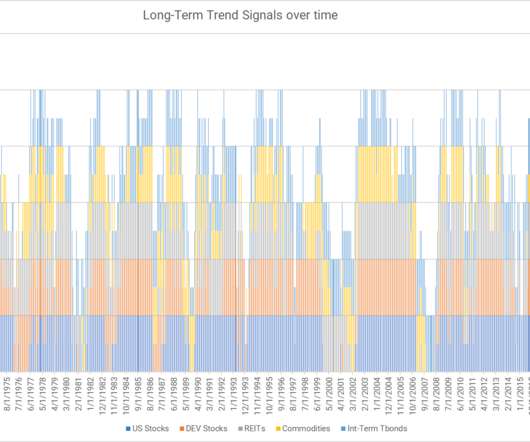
The analysis above highlights that we are in a rare regime when commodities are the only long asset with a positive trend. But we do know that post-1973 we entered a world where, for several decades (at least up to around 2007), both bonds and commodities were an important component of a diversified portfolio. Will this happen again?
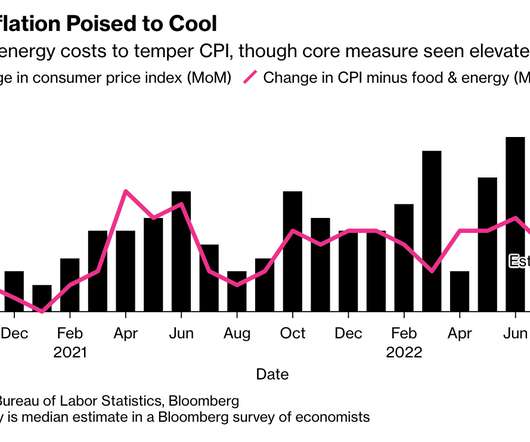
It is an oddity of how BLS assembles its CPI model, trying to figure out how to measure shelter which is both a cost and for millions of homeowners, an asset. This is because a home is an asset, and an increase in its value does not impose a “cost” on the homeowner. Bloomberg: CPI Inflation Data is a “Lie” (September 26, 2007).
which has $34 billion in assets under management. Graeme joined Orbis in 2007 and is responsible for international equity and optimal strategies. This week, we speak with Graeme Forster, a director at Orbis Investments Ltd.,
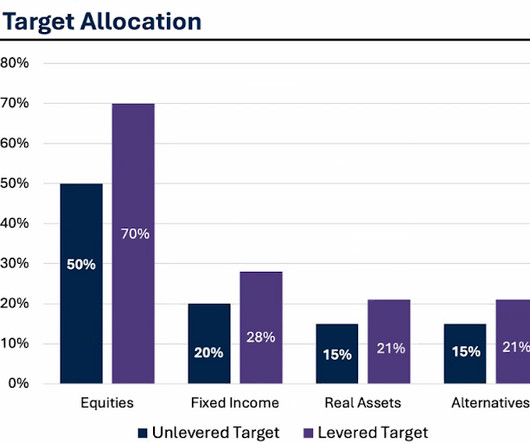
It has been my experience when reviewing portfolios that diversification is typically expressed simply as a number of various stocks owned, or owning a handful of asset classes, usually stocks of various sizes and geographies, and bonds of varying maturities.
He is the Chief Investment Officer of Asset and Wealth Management at Goldman Sachs. He co-chairs a number of the asset management investment committees. trillion in assets under supervision. JULIAN SALISBURY, CHIEF INVESTMENT OFFICER OF ASSET AND WEALTH MANAGEMENT, GOLDMAN SACHS: Thanks, Barry. And I think you will also.
Equity markets corrected by more than 50% in 2000-01 and more than 60% in 2007-08 which lasted for 1.5-3 Like the circle of life, good times are followed by bad times, and bad times are followed by good times, stock markets also go through cycles of excessive greed/optimism to excessive fear/pessimism.
This caused a fear over the weekend that we might see a repeat of 2007-2009. This explainer will lay out what happened, what the response was and why this is not like 2007-2009. When this run started, Silicon Valley Bank (and the two other banks that failed), put into play plans to raise capital beyond selling these assets.
For example, the six-month Treasury bill yields around 5.12% as of this writing – the highest level since 2007. This is a significant break from the post-Global Financial Crisis era when low bond rates pushed yield-hungry investors into speculative investments and asset classes.
The creator(s) of this first-of-its-kind asset developed the cryptocurrency in response to the Great Recession of 2007-2009 , spurred by a distrust of the traditional banking system and concerns about its stability. Read on for insights on Bitcoin milestones, historical returns, and how its returns compare to those of other assets.
banks, one in which government bonds would be the “toxic asset” at the center of it all.That’s one of two scenarios being entertained by European global investment manager Eric Sturdza Investments, which managed $1.3 billion across eight funds as of January. The fund manager couldn’t immediately be reached for further comment.“It
It’s important to consider not just debt but also assets and discretionary income when evaluating the overall financial health of consumers. Overall, consumer balance sheets are in strong shape , especially when compared to the Great Recession (2006-2007). Stay tuned for next week.
Thinking about all this, I felt I had read about this and observed it in 2007. However, I would insist on following an asset allocation plan with discipline, which is unaffected by the emotions of greed and fear. Asset allocation should follow probabilities of future outcomes along with risk profile.
The selloff in risk assets came after several Federal Reserve speakers recently stressed the need to keep bringing stubbornly high inflation levels down toward the central bank’s 2% annual target. Treasury yields on Tuesday also jumped, with the 2-year rate BX:TMUBMUSD02Y climbing to 4.729%, its highest level since 2007.
stocks closed near session lows on Wednesday after the Federal Reserve raised rates as expect by another 25 basis points, bringing the policy rate to its highest level since 2007. First Republic Bank also was seized by regulators on Monday and its assets were sold to JPMorgan Chase & Co. The S&P 500 index SPX shed 0.7%
They run over $800 billion in client assets, and Kristen’s group, the North American Group, is responsible for about half of the revenue that that massive organization generates. At Citi, in 2007, fantastic timing, you take over as Head of Structured Solutions. And so, 2007, I came over to Citi. BITTERLY MICHELL: Always risk.
When I first was using a managed futures fund for clients, so talking 2007 or so, I stumbled into the idea that part of the past success came from interest earned on T-bills. The vast majority of the assets are in cash or cash equivalents. Client/personal holding Princeton Premium Fund (PPFAX/PPFIX) has 99% in cash.
Based on Cambria's other multi-asset funds, ENDW will probably have fixed income duration but that's a space I will continue to avoid. The S&P 500 hit 1500 in March 2000, then again in the fall of 2007 and then the third and final time in January, 2013. The results. Most of us of course lived through that from 2000 through to 2009.
Between the 1970s and 2007, value investing—where investors identify stocks that are trading below their intrinsic value—reigned supreme for two generations of investors. Many investors hopped on his bandwagon and received outstanding returns for decades, until the financial crisis in 2007, the article relates.
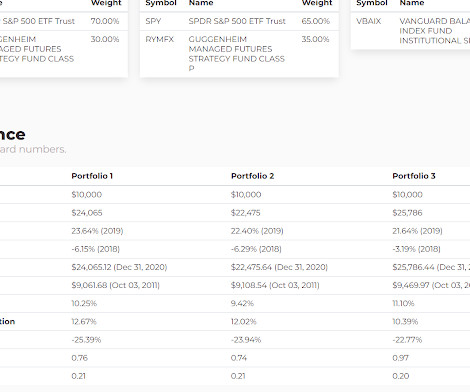
There's no fact sheet yet and while the holdings are available, the asset allocation is vague without calculating the spreadsheet yourself which I did (hopefully correctly). To my knowledge, RYMFX was the first managed futures mutual fund and it had the space to itself for several years after in launched in 2007.
Canara Bank – Canara Robecco AMC Canara Bank is set to make waves in the asset management sector with the planned IPO of its mutual fund arm, Canara Robeco Mutual Fund. Canara Robeco Mutual Fund, a joint venture between Canara Bank and the Robeco Group since 2007, has shown impressive growth with assets under management worth ₹839.3
This generation’s fortune-teller has been Michael Burry, who called the 2007-2008 housing bubble burst early on. Unlike a lot of pundits, Burry risked his own money on his 2007 housing call and other stock picks that delivered high rewards. His firm Scion bought puts on two popular index funds, betting on a looming downturn.
Here's the latest about Harvard from Bloomberg that included this chart of the asset allocation. It's not that someone could not copy the asset class exposure, just that the return streams would not look the same and often, various forms of sophistication replication does not really work in fund form. Is my opinion incorrect though?
In other words, if you’re 65 in 2007 and 100% invested in stocks and then 2008 happens then you end up going back to work until you’re at least 70. And the only way that disaster happens is if your financial planner is making irrational projections about asset returns and your asset allocation. That’s a lifestyle DISASTER.
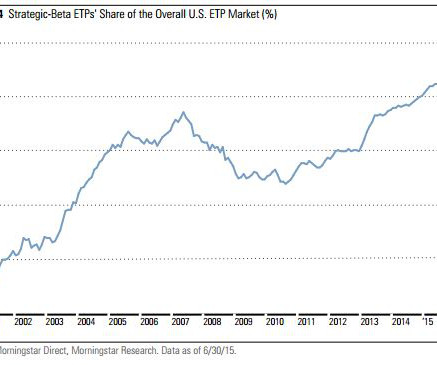
According to Morningstar , “Strategic Beta” now accounts for 21% of total industry (ETP) assets, up from under 5% in 2000. As assets have exploded, so too has the number of strategic-beta ETPs, which have grown from 673 to 844 in the past year, while assets grew 25% to $497 billion.
O’Shaughnessy Asset Management, became a leader in direct indexing, eventually was bought by Franklin Templeton, leading him to launch O’Shaughnessy Ventures, O’Shaughnessy Fellowships, infinite Loops podcast, just so many different things. You let your son Patrick take over as CEO of, of Shawnessy Asset Management.
One is we were securitizing the assets in the auto loan and selling them off to other asset managers because we weren’t able to buy them ourselves. The requirements for asset managers to have a bank were such that it would inhibit us a bit. JOHNSON: …for most assets. I also ran our credit card business at the time.
We organize all of the trending information in your field so you don't have to. Join 36,000+ users and stay up to date on the latest articles your peers are reading.
You know about us, now we want to get to know you!
Let's personalize your content
Let's get even more personalized
We recognize your account from another site in our network, please click 'Send Email' below to continue with verifying your account and setting a password.


Let's personalize your content