This site uses cookies to improve your experience. To help us insure we adhere to various privacy regulations, please select your country/region of residence. If you do not select a country, we will assume you are from the United States. Select your Cookie Settings or view our Privacy Policy and Terms of Use.
Cookie Settings
Cookies and similar technologies are used on this website for proper function of the website, for tracking performance analytics and for marketing purposes. We and some of our third-party providers may use cookie data for various purposes. Please review the cookie settings below and choose your preference.
Used for the proper function of the website
Used for monitoring website traffic and interactions
Cookie Settings
Cookies and similar technologies are used on this website for proper function of the website, for tracking performance analytics and for marketing purposes. We and some of our third-party providers may use cookie data for various purposes. Please review the cookie settings below and choose your preference.
Strictly Necessary: Used for the proper function of the website
Performance/Analytics: Used for monitoring website traffic and interactions
The headline jobs number in the October employment report was above expectations, and employment for the previous two months was revised up by 29,000, combined. This graph really shows the collapse in retail hiring in 2008. This is below pre-recession levels and the fewest part time workers (for economic reasons) in over 20 years.
The headline jobs number in the December employment report was above expectations, however employment for the previous two months was revised down by 28,000, combined. This graph really shows the collapse in retail hiring in 2008. Unemployed over 26 Weeks This graph shows the number of workers unemployed for 27 weeks or more.
The headline jobs number in the November employment report was above expectations, however employment for the previous two months was revised down by 23,000, combined. This graph really shows the collapse in retail hiring in 2008. Unemployed over 26 Weeks This graph shows the number of workers unemployed for 27 weeks or more.
The sentiment is especially poignant when it comes to economic forecasting, as it's nearly impossible to get an accurate picture of the current state of the economy at any given moment. Businesses are also feeling the pinch from higher interest rates, as November saw a rapid increase in the number of Chapter 11 commercial bankruptcies.
The headline jobs number in the October employment report was below expectations, and employment for the previous two months was revised down by 101,000, combined. This graph really shows the collapse in retail hiring in 2008. The number of persons working part time for economic reasons increased in October to 4.28
The headline jobs number in the November employment report was at expectations, however employment for the previous two months was revised down by 35,000, combined. This graph really shows the collapse in retail hiring in 2008. The number of persons working part time for economic reasons decreased in November to 3.99
The headline jobs number in the December employment report was above expectations, however employment for the previous two months was revised down by 71,000, combined. This graph really shows the collapse in retail hiring in 2008. The number of persons working part time for economic reasons decreased in December to 4.21
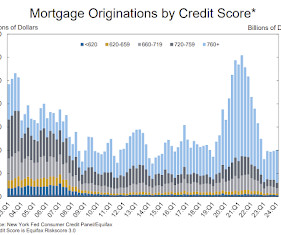
The New York Fed also issued an accompanying Liberty Street Economics blog post examining credit card utilization and its relationship with delinquency. An increasing number of borrowers missed credit card payments, revealing worsening financial distress among some households.” trillion at the end of March. rise from 2023Q4.
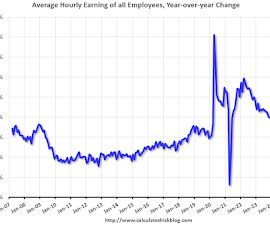
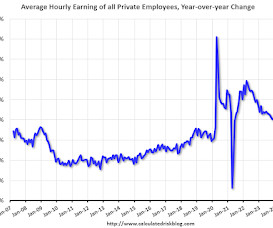
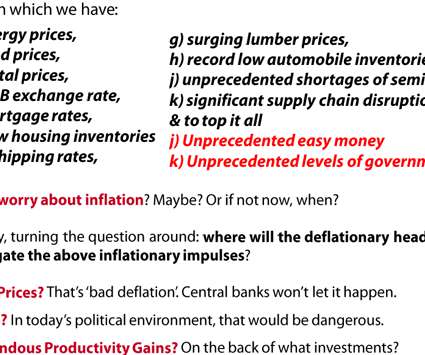
I have detailed over the past decade or so the lagging nature of wages in America — deflationary in economic terms — and how that had begun to change in the late 2010s pre-pandemic. By any measure, we still have an enormous number of unfilled positions. It’s just off the peak, but still extremely high by any measure.
At the end of each year, I post Ten Economic Questions for the following year (2023). And that means prices probably won’t decline sharply like in 2008 when prices fell about 12% according to the Case-Shiller National Index. I followed up with a brief post on each question. Here is review (we don't have all data yet, but enough).
My back-to-work morning train WFH reads: • The state of the economy on Election Day, explained in 6 numbers : Rising prices have weighed heavily on the minds of voters who will soon determine the outcome of elections across the country. ( New York Times ). • Global Biodiversity: A Stable Ecosystem Yields Stable Economics : The U.N. . •
Earlier I posted some questions on my blog for next year: Ten Economic Questions for 2023. Job losses in construction haven't started yet because a record number of housing units are under construction. Here are the Ten Economic Questions for 2023 and a few predictions: • Question #2 for 2023: How much will job growth slow in 2023?
Following the Great Financial Crisis of 2008 a number of macro doom-and-gloomers began predicting a collapse of the U.S. It was an appealing narrative if you were someone stuck in the negative feedback loop of the biggest economic crash since the Great Depression. The Fed was “printing” trillions of dollars.
And there’s a fair number of people who say 70%, two thirds of the stock market without any risk at all, market risk that is – sign me up for that. It’s a number that’s put out every Thursday for the previous week. That is, over the last 50 years, an extraordinarily low number. It’s a state program.
The last time the S&P 500 fell more than 1% in November was in 2008, and it has been higher 11 of the past 12 years. However, this shouldn’t be a big surprise because we knew Hurricanes Milton and Helene would weigh on the numbers. But those numbers are backward looking. We just didn’t know how much.
Unusual Economic Indicators : You might have heard about indicators like the Big Mac Index (if you haven’t, you can read our previous article). Today, we’ll introduce you to some unusual economic indicators that might predict the economic conditions. Most Unusual Economic Indicators 1. What is it? What is the proof?
Question of the Day Q: Did the beat the street numbers put a Fed pivot back in play? The yield on the two-year Treasury note fell to 4.32% from 4.63%, the biggest one-day decline since 2008 The 10-year yield fell to 3.83% from 4.15%, the biggest one-day drop since 2009. percent year over year. Actual was 0.4 month over month vs 0.7
Those other times we saw fear similar to this were times like the recession and near bear market of 1990, October 2008 and March 2009 during the Great Financial Crisis, and the end of the bear market in 2022. And lower exports are a drag on US economic growth. These numbers are well ahead of the pace of inflation.
Over the past four weeks, money markets have added $300 billion, on par with surges in 2008 and 2020, bringing the total to a record $5.1 If market conditions were what they are now back in 2008, the equity market would have been under severe stress. Lost in the focus on global banking issues were some encouraging economic data.
However, shifting economic conditions, a potential rate-cut cycle, and valuation opportunities have created a renewed focus on small and mid-cap stocks, particularly in financials and energy. This bracket focuses on who benefits most when the Russia-Ukraine war ends and economic rebuilding begins.
MLB was last to the instant replay party, finally adding it to check on home runs on August 28, 2008, nine years after Frank Pulli dipped his toe into the water. Over more than a decade (2008-2019), Major League home-plate umpires made every pitch call correctly on one team roughly twice per season. The NBA followed suit in 2002.
Nifty 50 first hit 10,000 on July 26, 2017, and it took more than 21 years to double that number. For many people, 20,000 is not just a number; but happiness for many. 2008 – Global financial crisis The 2008 financial crisis was known as the biggest disaster after The Great Depression. on July 20, of this year.
These numbers can and will be revised, and so it helps to look at the 3-month average. That number has been trending down since earlier this year, but it’s at a healthy 177,000 right now, above the 166,000 average pace in 2019. Not exactly weak (the hiring rate collapsed below 3% during the 2008-2009 recession), but not too hot either.
24th October 2008 US Financial Crisis 1070 10.95%. 21st January 2008 US Financial Crisis 1408 7.40%. 17th March 2008 US Financial Crisis 951 6.03%. — The 2008 Financial Crisis. The 2008 financial crisis was known as the biggest disaster after The Great Depression. Crash Date Event Points Lost % Lost.
The most widely accepted definition of a recession is two consecutive quarters of negative economic growth, as measured by GDP. However, more recently, the description has expanded to include other economic criteria, including depth, diffusion, and duration. Recessions create an unpredictable economic environment. annualized.
And if you’re able to do that in a diverse number of markets and asset classes, while managing risk in the markets that aren’t trending, you know, that’s in general how trend following works. How do you contextualize the economic data and the broad stamp recession when you’re thinking about managing risk?
To date the only evidence, we have that this is working is a single set of inflation numbers showing a slight downtick in the headline numbers. The low reading in June matches levels we’ve seen in many bear markets but not what we saw during the Financial Crisis of 2008 or the Covid Lows of 2020. and today is over 41%.
While economic growth may have peaked in the third quarter, we expect the economy to remain supportive. Keep in mind the trajectory of economic growth was not a given, considering the scale of the shocks. percentage points to the headline number. Stocks continue to struggle, but that is not abnormal for this time of year.
By Justin Carbonneau ( Twitter | LinkedIn | YouTube ) — Over the past few weeks, I’ve seen a number of charts highlighting the opportunity in small-cap stocks given their absolute and relative valuations. There are a number of risk-based drivers that explain some of the valuation spreads that currently exist. Only 12.4%
I had my first child in June of 2008. Now, the first half of 2008, I was doing pretty well in the fund. But of course, I didn’t know the world was gonna meltdown in 2008. I bought Priceline on November 1st, 2008. And we would go on to sell that business to Microsoft in 2008. I think I was up 20 or 25%, right?
Fuson is from the old school and thinks there are some things numbers just can’t tell you that intuition can. Baseball isn’t just numbers. They don’t have our experience and they don’t have our intuition. ” “Okay” “You got a kid in there that’s got a degree in economics from Yale. It’s not science. Failing to admit you’re wrong?
Louis Gave, co-founder and CEO of Gavekal Research, recently said that most economic activity is simply transformed energy of one sort or another. Source: Gavekal You can see in the chart above how wages dropped in the 2000 recession and even more obviously in the 2008–2010 period.
That occurred as the 2-year Treasury yield experienced its biggest-monthly plunge since January 2008, and the 10-year BX:TMUBMUSD10Y had its largest monthly drop since March 2020. As Monday’s trading wore on, investors regarded higher oil prices as beneficial for some U.S. rates strategist at TD Securities in New York.“It’s
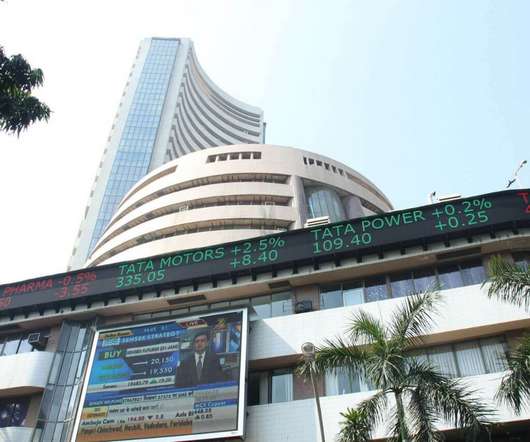
The NSE remained the world’s largest derivatives exchange for the second consecutive year in 2020 in terms of the number of contracts traded. 38 Adani Port and Special Economic Zone Ltd. Moreover, when Sensex/Nifty goes high, it shows the economic growth of the country. — NIFTY or Nifty 50. FINANCIAL SERVICES 0.74%.
And you know that they’re probably no longer as reassured by the message “It’s about time in the market, not timing the market” and being pointed back to 2008. Something about our current volatile economic climate feels different. If together you can weather this economic storm, there will be greater confidence moving forward.
So, so let’s talk a little bit about your, your background ba in economics from Dartmouth. ’cause then I figure I could always be employed either managing the numbers or doing law and get those two degrees. It’s a pleasure to be here. Barry Ritholtz: 00:01:26 [Speaker Changed] It it’s a pleasure to have you.
The hangover from COVID has created significant supply chain disruptions and widespread economic shortages. Source: Trading Economics. The rising Baker Hughes drilling rig count below reflects the miracle of supply-demand economics operating in full force. Source: Trading Economics. Source: GasBuddy.com.
Since the 2008–09 credit crisis, market sentiment on European stocks has shifted back and forth, from despair to confidence, depending largely on sentiment regarding the EU’s prospects as a viable political and economic entity. Take Europe, for instance. But it is a meaningful change worthy of discussion after a long period of time.
Since the 2008–09 credit crisis, market sentiment on European stocks has shifted back and forth, from despair to confidence, depending largely on sentiment regarding the EU’s prospects as a viable political and economic entity. Take Europe, for instance. But it is a meaningful change worthy of discussion after a long period of time.
Powell’s comments in the press conference and the update to the Statement of Economic Projections (“dot plot”) will be closely watched. However, not all data is bad, with the Citigroup Economic Surprise Index at +58m the highest reading in nearly a year, and the Atlanta Fed’s GDPNow model forecasts 3.2% Consumer price inflation rose 0.4%
I remember when I entered the job market in the 70s (yes, I’m a boomer) we bemoaned our fate of being boomers because we were being spewed out of college and into the labor force in unprecedented numbers, driving competition for jobs up and wages down. And BTW, competition to get into college was very rough because of our numbers.
gain, but not a bad number by any means. These include some of the worst years in stock market history, including 1973, 1974, the tech bubble, 2008, and 2022. That means labor productivity continues to run strong, as workers are producing above-trend output while working the same number of hours. median return.
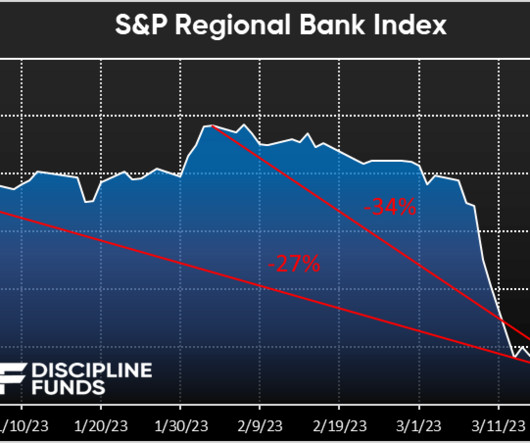
Pretty big numbers. It’s why economics is as much social science as hard science. This wasn’t a 2008 style bank panic where the banks were insolvent because their customers were defaulting on bad loans. This week’s chart of the week shows the S&P Regional Bank index performance year-to-date.
That’s not suggesting another 2008 is coming, but rather highlights how fast the economic environment can change. Along with the statement, the Committee updated the Summary of Economic Projections (SEP), which is arguably more important than the brief monetary policy statement.
We organize all of the trending information in your field so you don't have to. Join 36,000+ users and stay up to date on the latest articles your peers are reading.
You know about us, now we want to get to know you!
Let's personalize your content
Let's get even more personalized
We recognize your account from another site in our network, please click 'Send Email' below to continue with verifying your account and setting a password.


Let's personalize your content