This site uses cookies to improve your experience. To help us insure we adhere to various privacy regulations, please select your country/region of residence. If you do not select a country, we will assume you are from the United States. Select your Cookie Settings or view our Privacy Policy and Terms of Use.
Cookie Settings
Cookies and similar technologies are used on this website for proper function of the website, for tracking performance analytics and for marketing purposes. We and some of our third-party providers may use cookie data for various purposes. Please review the cookie settings below and choose your preference.
Used for the proper function of the website
Used for monitoring website traffic and interactions
Cookie Settings
Cookies and similar technologies are used on this website for proper function of the website, for tracking performance analytics and for marketing purposes. We and some of our third-party providers may use cookie data for various purposes. Please review the cookie settings below and choose your preference.
Strictly Necessary: Used for the proper function of the website
Performance/Analytics: Used for monitoring website traffic and interactions
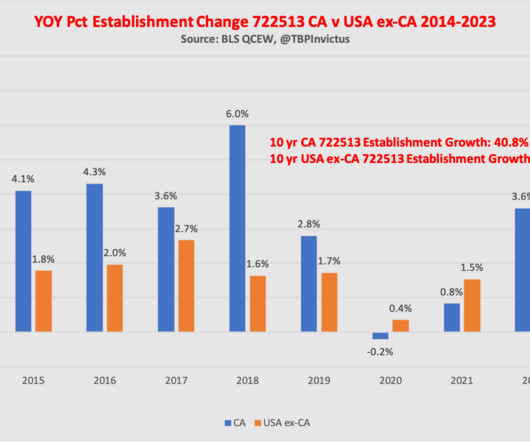
To prove their point, a number of friendly commentators, academics, and hired guns all wrote endless white papers, Op-Eds and commentaries. But they made one super-sized mistake: they cheated with the numbers. Let’s have a look: Over the 10 year period from 2014 to 2023, CA has grown its QSR workforce by 31.5%
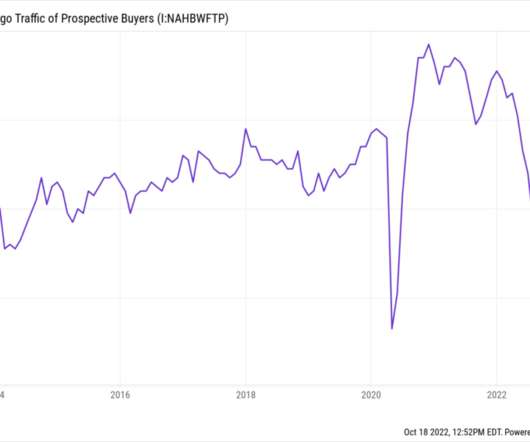
This brings us to the chart: The one above shows the traffic of prospective buyers looking at a new home (2014- 2022); the one below goes back to the 1980s. The four largest drops occurred during distinct periods of economic distress: 1990 (recession), 2006-09 (GFC), 2020 (pandemic/recession), and today (FOMC 300 bp rate hike).
Source: FRED Wealth disparities get ever more lopsided the higher up the economic strata you climb; there is more disparity with the top 1% than the top 10%, but the biggest spreads are at the top 0.1% (and above). Consider the chart at top, created by Invictus via FRED. And, it has accelerated over the past few decades.
The number of working-age persons people not in the labor force rose by 359,000 in November and is back over 100 million. Birth Death Model Starting January 2014, I dropped the Birth/Death Model charts from this report. The model is wrong at economic turning points and is also heavily revised and thus essentially useless.
Reservation Wage Between March 2014 and March 2020 Working: +19.3 With demand for jobs in some sectors still high, and increasing number of boomers retiring, we have intense wage pressures. Regarding expectations, the average expected wage offer (conditional on receiving one) also increased and reached a new high.
Nifty 50 first hit 10,000 on July 26, 2017, and it took more than 21 years to double that number. For many people, 20,000 is not just a number; but happiness for many. The Ripple effect saw the market fall a number of times in 2008. On September 1, 2014, the Nifty touched 8,000. Now, Nifty is on its way to 21,000 points.
Articles In hindsight, we can see that the value in 2014 $AAPL was real while the value in 2014 $IBM was fake. By Barry Ritholtz People’s actions don’t always live up to rational economic theories because of unintended consequences By Ben Carlson Every past decline looks like an opportunity, every future decline looks like a risk.
economic impact of the Eras tour at close to $5 billion. The authors claimed that the next generation of consumers would prefer compelling experiences over products, and proclaimed the arrival of the fourth economic frontier, following the agrarian, industrial and service economies. One research company estimates the potential U.S.
Barry Ritholtz : The the funny thing is, the behavioral aspect of mutual funds seems to have been when people finally learn about a manager who’s put up great numbers, by the time it makes to make makes it to Forbes, hey, most of that run is probably over and a little mean reversion is about to kick in.
The third quarter’s blockbuster productivity data follows a hot number from the prior quarter, when productivity rose 3.5% (annualized). Economic output regained its pre-pandemic level by the first quarter of 2021, with 8 million fewer workers, which translated to higher productivity per worker.
India’s IPO market has made a strong comeback this year, making it the global leader in the number of IPOs so far in 2023 and attracting investors to take advantage of the renewed interest in public offerings on Dalal Street. What do the numbers tell about IPOs? 2014 5 0.14 2015 21 1.63 2016 26 3.18 2017 36 8.06
These numbers can and will be revised, and so it helps to look at the 3-month average. That number has been trending down since earlier this year, but it’s at a healthy 177,000 right now, above the 166,000 average pace in 2019. and matches what we saw all the way back in 2014. That’s below the 2019 average of 3.9%
In the past 10 years, the index has had substantial growth, and it has increased by 301.90% from July 2014 until July 2024. In the past decade, the index has had significant growth, and it has increased by 225.27% from July 2014 until July 3, 2024. It’s an American stock exchange based in New York City, USA. trillion as of May 2024.
In 2014 , the use of replay in MLB was expanded and is now an expected part of the game, as it is in all major professional sports, even though “judgment calls” like balls and strikes, remain unreviewable. The NBA followed suit in 2002. Larry Vanover was the worst, at 92.1 Notice how much higher those scores (even the worst score!)
We entered the liquid alts market with hedge funds back in 1994, and we entered the private market in 2014 with my product in late stage growth. And now we have a number of different hedge funds, some we have in the macro, we have multi-Strat, we have point hedge funds with in technology in the healthcare field.
All the sectors went up with major sectoral growth seen in auto (up 22%), realty (up 33%), and consumer durables (up 13%) on the back of an improving economic outlook. Year-on-year declines in energy prices were the major contributor to overall inflation numbers across developed economies.
Making to England Soros worked jobs as a waiter or railway porter before he graduated from the London School of Economics. From 1994 to 2014 Renaissance Technologies Medallion fund gave a whopping 71.8% Steve Cohen Billionaire Steve Cohen came from an economics and poker background. Simons is today worth $24.6
market for several years, but there are a large number of significant geopolitical and regional matters that are impacting investments all over the globe. Asked if he is seeing a lot of activity driven by economic stimulus like the Inflation Reduction Act, Mick said he is really seeing the impact of the new U.S.
market for several years, but there are a large number of significant geopolitical and regional matters that are impacting investments all over the globe. Asked if he is seeing a lot of activity driven by economic stimulus like the Inflation Reduction Act, Mick said he is really seeing the impact of the new U.S.
The good news is that the preponderance of economic data clearly tells us we’re not in a recession right now. Other than during the heights of the pandemic, the last time hiring was at this level was in 2014. It’s correctly indicated every recession since 1970. It’s unclear why employers have stopped hiring as much as they have.
He’s particularly known for: Distressed debt investing – buying bonds of troubled companies at deep discounts Macro trading – making large bets based on his economic outlook Concentrated positions – taking large stakes in his highest conviction ideas This approach has led to stellar long-term performance.
Heather comes from with a fascinating background, having previously been in a number of other places, most notably Morningstar, and, and she has a very specific approach to investment management and thinking about stock selection. They do a number of things at Diamond Hill that many other investment shops don’t.
Since the 2008–09 credit crisis, market sentiment on European stocks has shifted back and forth, from despair to confidence, depending largely on sentiment regarding the EU’s prospects as a viable political and economic entity. Currencies: Our analysis shows that between 1978 and 2014, currency movement explained 50% of the U.S.
Since the 2008–09 credit crisis, market sentiment on European stocks has shifted back and forth, from despair to confidence, depending largely on sentiment regarding the EU’s prospects as a viable political and economic entity. Currencies: Our analysis shows that between 1978 and 2014, currency movement explained 50% of the U.S.
in 2014 to $12.20 The Qualitative Case for Lululemon While Validea’s quantitative model gives Lululemon a near-perfect score, Buffett’s investment philosophy goes beyond just the numbers. He seeks businesses with durable competitive advantages or “economic moats.” in the most recent fiscal year.
Shifting macro cycles and heightened volatility across financial markets are only half the story, as investors and companies in a post-COVID world grapple with an ongoing geopolitical realignment and the increasing prospects of an economic recession. as a result of meaningful inflation across the economic system (Figure 3).
War and financial turmoil— the bane of Europe’s economic well-being last century—are currently veiling a rebound in regional growth and unanticipated vigor among European companies. in 2014, according to the International Monetary Fund (IMF). Economic recoveries usually feature a surge in consumption as employment and wages rebound.
Instead, we’re looking 10, 20 or 30 years ahead—a long enough horizon to smooth out short-term fluctuations resulting from variables such as economic cycles, changes in interest rates and geopolitical events. over the last 100 years (1915–2014), but interestingly, they increased to 7.9% over the more recent 30-year period.
Instead, we’re looking 10, 20 or 30 years ahead—a long enough horizon to smooth out short-term fluctuations resulting from variables such as economic cycles, changes in interest rates and geopolitical events. over the last 100 years (1915–2014), but interestingly, they increased to 7.9% over the more recent 30-year period.
Since 1980 through 2014, workers with retirement plans that included a pension fell from 39% to 13%, a 200% decline. In general, when it comes to finance and economics, we tend to discuss everything as choice or options,” said Tanja Hester, author of “Work Optional: Retire Early the Non-Penny-Pinching Way.”
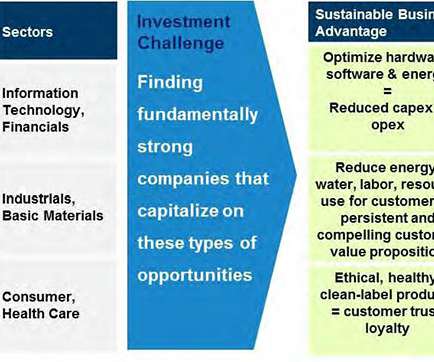
Here, we will discuss some of the reasons why we think that link is so strong, and provide a number of examples of portfolio companies whose sustainable business models have directly contributed to their strength in declining markets. All charts, economic and market forecasts presented herein are for illustrative purposes only.
Here, we will discuss some of the reasons why we think that link is so strong, and provide a number of examples of portfolio companies whose sustainable business models have directly contributed to their strength in declining markets. All charts, economic and market forecasts presented herein are for illustrative purposes only.
A degree in mathematics from Oxford, a doctorate in mathematical epidemiology and economics from Cambridge. Graham Foster] : 00:02:54 That was a number, that was number theory, pure number theory. And whether it’s all numbers or even numbers. [Barry Ritholtz] : So you have a fascinating background.
For this reason, the Global Leaders strategy has never invested in tobacco companies, despite the fact that the addictive nature of nicotine has fostered powerful economic engines in many cases. Through this important role, the company has been rewarded with approximately a 22% return on equity over the past five calendar years (2014-2018).
For this reason, the Global Leaders strategy has never invested in tobacco companies, despite the fact that the addictive nature of nicotine has fostered powerful economic engines in many cases. Through this important role, the company has been rewarded with approximately a 22% return on equity over the past five calendar years (2014-2018).
The expected competitive forces don’t materialise, and we believe that superior economics can be maintained for a lot longer than our standard microeconomics mean-reversion frameworks would suggest. In the period 2010 to 2014 there was a boom in energy capex particularly into U.S. The key to this is analysis of the supply-side.
The government reported a 7% expansion in gross domestic product for the first half of the year, and wages are rising at about 10%—not exactly a picture of economic disaster. Finally, Beijing has seen confidence in its economic management erode following its failed efforts to arrest a tailspin in the country’s boom-and-bust stock markets.
Stock market volatility has spiked in response to immediate market concerns about energy prices, weakening economic growth in China and changes to monetary policy, as well as momentous capital-market shifts during the past 20 years. In their 2014 book, Think Like A Freak, they talk about our reluctance as a species to say these words.
There are a number of reasons that clients may be interested in adding green bonds to their portfolios. Finally, it benefits from relatively strong economic conditions in the regions it serves. Duration is expressed as a number of years. Bond prices are said to have an inverse relationship with interest rates.
There are a number of reasons that clients may be interested in adding green bonds to their portfolios. Finally, it benefits from relatively strong economic conditions in the regions it serves. Duration is expressed as a number of years. Bond prices are said to have an inverse relationship with interest rates.
While these efforts are valuable – they may eventually lead to well-defined ESG factors that resonate with economic principles – it is easy to forget that they cannot prove whether "ESG investing" can be a source of market-independent returns, or alpha. Resource and Energy Economics 41:103-121. Hammond, and W. Springsteel. Douglas, E.,
While these efforts are valuable – they may eventually lead to well-defined ESG factors that resonate with economic principles – it is easy to forget that they cannot prove whether "ESG investing" can be a source of market-independent returns, or alpha. Resource and Energy Economics 41:103-121. References. Hammond, and W. Springsteel.
In other words, these investments (or “teams”) are ranked and seeded on a number of factors but one of the main drivers is how hot they recently performed within the past few months or recent year. We still like Energy this year and that is especially so with it being one of the most beaten down economic sectors from 2023.
Decades of research on stock returns has produced a vast number of published factors. 20591, National Bureau of Economic Research, October 2014). Relative price : Refers to a company’s price, or the market value of its equity, in relation to another measure of economic value, such as book value. 1 (January 2016): 69–103.
We organize all of the trending information in your field so you don't have to. Join 36,000+ users and stay up to date on the latest articles your peers are reading.
You know about us, now we want to get to know you!
Let's personalize your content
Let's get even more personalized
We recognize your account from another site in our network, please click 'Send Email' below to continue with verifying your account and setting a password.


Let's personalize your content