This site uses cookies to improve your experience. To help us insure we adhere to various privacy regulations, please select your country/region of residence. If you do not select a country, we will assume you are from the United States. Select your Cookie Settings or view our Privacy Policy and Terms of Use.
Cookie Settings
Cookies and similar technologies are used on this website for proper function of the website, for tracking performance analytics and for marketing purposes. We and some of our third-party providers may use cookie data for various purposes. Please review the cookie settings below and choose your preference.
Used for the proper function of the website
Used for monitoring website traffic and interactions
Cookie Settings
Cookies and similar technologies are used on this website for proper function of the website, for tracking performance analytics and for marketing purposes. We and some of our third-party providers may use cookie data for various purposes. Please review the cookie settings below and choose your preference.
Strictly Necessary: Used for the proper function of the website
Performance/Analytics: Used for monitoring website traffic and interactions
Notes: I've added back gasoline supplied to see if there is an impact from higher gasoline prices. -- Airlines: Transportation Security Administration -- The TSA is providing daily travel numbers. This data is as of September 11th. Click on graph for larger image. Black is 2020, Blue is 2021 and Red is 2022.
Notes: I've added back gasoline supplied to see if there is an impact from higher gasoline prices. -- Airlines: Transportation Security Administration -- The TSA is providing daily travel numbers. This data is as of August 7th. Click on graph for larger image. Black is 2020, Blue is 2021 and Red is 2022.
It was interesting to watch these sectors recover as the pandemic impact subsided. -- Airlines: Transportation Security Administration -- The TSA is providing daily travel numbers. This data is as of November 6th. Click on graph for larger image. Black is 2020, Blue is 2021 and Red is 2022. The data is from BoxOfficeMojo through November 3rd.
Notes: I've added back gasoline supplied to see if there is an impact from higher gasoline prices. -- Airlines: Transportation Security Administration -- The TSA is providing daily travel numbers. This data is as of September 4th. Click on graph for larger image. Black is 2020, Blue is 2021 and Red is 2022.
Notes: I've added back gasoline supplied to see if there is an impact from higher gasoline prices. -- Airlines: Transportation Security Administration -- The TSA is providing daily travel numbers. This data is as of September 25th. Click on graph for larger image. Black is 2020, Blue is 2021 and Red is 2022.
Apple has discontinued "Apple mobility", and restaurant traffic is mostly back to normal. -- Airlines: Transportation Security Administration -- The TSA is providing daily travel numbers. This data is as of July 31st. Click on graph for larger image. Black is 2020, Blue is 2021 and Red is 2022.
Notes: I've added back gasoline supplied to see if there is an impact from higher gasoline prices. -- Airlines: Transportation Security Administration -- The TSA is providing daily travel numbers. This data is as of August 21st. Click on graph for larger image. Black is 2020, Blue is 2021 and Red is 2022.
It is interesting to watch these sectors recover as the pandemic subsides. -- Airlines: Transportation Security Administration -- The TSA is providing daily travel numbers. These indicators are mostly for travel and entertainment. This data is as of October 23rd. Click on graph for larger image. Black is 2020, Blue is 2021 and Red is 2022.
It is interesting to watch these sectors recover as the pandemic subsides. -- Airlines: Transportation Security Administration -- The TSA is providing daily travel numbers. These indicators are mostly for travel and entertainment. This data is as of October 30th. Click on graph for larger image. Black is 2020, Blue is 2021 and Red is 2022.
Notes: I've added back gasoline supplied to see if there is an impact from higher gasoline prices. -- Airlines: Transportation Security Administration -- The TSA is providing daily travel numbers. This data is as of August 28th. Click on graph for larger image. Black is 2020, Blue is 2021 and Red is 2022.
It was interesting to watch these sectors recover as the pandemic impact subsided. -- Airlines: Transportation Security Administration -- The TSA is providing daily travel numbers. This data is as of November 13th. Click on graph for larger image. Black is 2020, Blue is 2021 and Red is 2022.
It is interesting to watch these sectors recover as the pandemic subsides. -- Airlines: Transportation Security Administration -- The TSA is providing daily travel numbers. These indicators are mostly for travel and entertainment. This data is as of October 15th. Click on graph for larger image. Black is 2020, Blue is 2021 and Red is 2022.
It has been interesting watching these sectors recover as the pandemic impact subsided. -- Airlines: Transportation Security Administration -- The TSA is providing daily travel numbers. This data is as of December 25th. Click on graph for larger image. Black is 2020, Blue is 2021 and Red is 2022.
It was interesting to watch these sectors recover as the pandemic impact subsided. -- Airlines: Transportation Security Administration -- The TSA is providing daily travel numbers. This data is as of December 4th. Click on graph for larger image. Black is 2020, Blue is 2021 and Red is 2022. The data is from BoxOfficeMojo through December 1st.
It is interesting to watch these sectors recover as the pandemic subsides. -- Airlines: Transportation Security Administration -- The TSA is providing daily travel numbers. These indicators are mostly for travel and entertainment. This data is as of October 8th. Click on graph for larger image. Black is 2020, Blue is 2021 and Red is 2022.
Notes: I've added back gasoline supplied to see if there is an impact from higher gasoline prices. -- Airlines: Transportation Security Administration -- The TSA is providing daily travel numbers. This data is as of August 14th. Click on graph for larger image. Black is 2020, Blue is 2021 and Red is 2022.
It was interesting to watch these sectors recover as the pandemic impact subsided. -- Airlines: Transportation Security Administration -- The TSA is providing daily travel numbers. This data is as of November 27th. Click on graph for larger image. Black is 2020, Blue is 2021 and Red is 2022.
Apple has discontinued "Apple mobility", and restaurant traffic is mostly back to normal. -- Airlines: Transportation Security Administration -- The TSA is providing daily travel numbers. This data is as of July 24th. Click on graph for larger image. Black is 2020, Blue is 2021 and Red is 2022.
It was interesting to watch these sectors recover as the pandemic impact subsided. -- Airlines: Transportation Security Administration -- The TSA is providing daily travel numbers. This data is as of December 18th. Click on graph for larger image. Black is 2020, Blue is 2021 and Red is 2022.
It was interesting to watch these sectors recover as the pandemic impact subsided. -- Airlines: Transportation Security Administration -- The TSA is providing daily travel numbers. This data is as of December 11th. Click on graph for larger image. Black is 2020, Blue is 2021 and Red is 2022.
It was interesting to watch these sectors recover as the pandemic impact subsided. -- Airlines: Transportation Security Administration -- The TSA is providing daily travel numbers. This data is as of November 20th. Click on graph for larger image. Black is 2020, Blue is 2021 and Red is 2022.
It is interesting to watch these sectors recover as the pandemic subsides. -- Airlines: Transportation Security Administration -- The TSA is providing daily travel numbers. These indicators are mostly for travel and entertainment. This data is as of October 2nd. Click on graph for larger image. Black is 2020, Blue is 2021 and Red is 2022.
nytimes.com) Regional banks are a linchpin for the economy. grist.org) Anti-Asian hate crimes have been rising since 2016. bloomberg.com) Economy Why we should be celebrating the current employment situation. tker.co) You can expect the Case-Shiller housing numbers to turn negative year-over-year in the next few months.
Consider these columns going back to 2013 pointing out the foolishness of tax-payer subsidized corporate welfare queens (2013), and why median wages were rising ( 2016 , 2017 , 2018 , 2018 , 2019 ). By any measure, we still have an enormous number of unfilled positions. Then came the pandemic, and a huge federal worker subsidy.
Along those lines, here are in chronological order, the thinkers who have helped shape how I view the world view, including how I philosophically think about the economy, markets, and investing. Sturgeon’s law suggest 300,00 of them are not crap – and that number seems generous. 10 Quotes That Shaped My Investment Philosophy 1.
To be a successful investor you need to possess a number of different traits. You need to understand how corporations and the global economy generally function over the long haul. Pour yourself a mug of coffee, grab a seat outside, and get ready for our longer-form weekend reads: • The Evolution of Financial Advice.
Midyear Planning Tools for 2016. Thu, 06/16/2016 - 15:22. Yet despite a heavy dose of recent market volatility, the planning environment in 2016 is relatively stable. Yet despite a heavy dose of recent market volatility, the planning environment in 2016 is relatively stable. Presidential election. Planning Tool: GRAT.
NOW 2016 | Hope vs. Fear: Winning the Hearts and Minds of Arab Youth achen Thu, 06/23/2016 - 10:27 The Middle East, although torn by conflict, shows long-term promise, with a proportionally large and growing population of youth that is online, tech savvy and eager to find economic opportunities.
NOW 2016 | Hope vs. Fear: Winning the Hearts and Minds of Arab Youth. Thu, 06/23/2016 - 10:27. Consequently, the younger population has splintered—a small number of terrorists make up one extreme, and a small number of entrepreneurs pursue their ambitions on the other extreme.
A changing political landscape, the state of the economy, donor sentiment, and industry changes are four areas which present challenges and opportunities alike. adults report donating to a political candidate in 2016, compared to 6% in 1992. households donating to charity decreased from 66% in 2000 to 53% in 2016.”
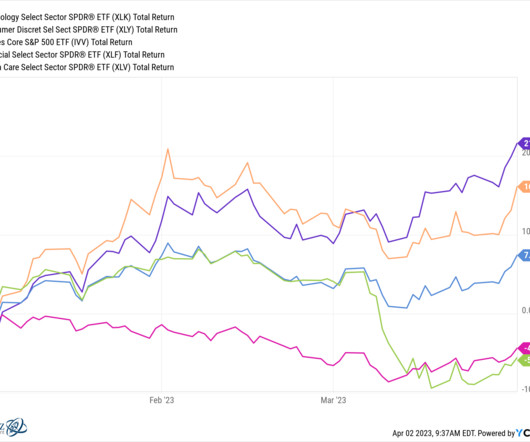
As we will discuss below in more detail, we still believe the US economy is just fine. 2016 and 2020, for instance, both saw significant weakness leading up to the election, then strong rallies after. Those numbers were the underpinning of a large upside surprise in July retail sales. But are we out of the woods yet? versus a 0.2%
Furthermore, it claims 59% in currency derivatives and 79% in interest rate derivatives in India, as of 2016. The exchange also received the CII EXIM Bank Excellence Prize in 2014 and 2016. The total number of shareholders is 15,596, with 14,030 being public shareholders. Additionally, the total number of shares is 49,50,00,000.
Have the discipline to give it to them By James Clear Diversification is a tough pill to swallow in hindsight By Nathan Faber Social Security and Medicare were the product of a consensus that the economy had broken the process of growing old. Today’s progressives argue, in part, that the economy has broken the process of growing up.
India’s IPO market has made a strong comeback this year, making it the global leader in the number of IPOs so far in 2023 and attracting investors to take advantage of the renewed interest in public offerings on Dalal Street. What do the numbers tell about IPOs? 2016 26 3.18 2014 5 0.14 2015 21 1.63 2017 36 8.06
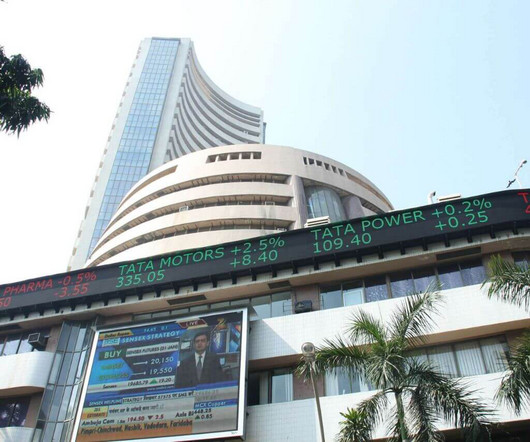
Nifty 50 first hit 10,000 on July 26, 2017, and it took more than 21 years to double that number. For many people, 20,000 is not just a number; but happiness for many. The Ripple effect saw the market fall a number of times in 2008. Since then, India has come a long way in the last 30 years. on July 20, of this year.
And he’s really moving the needle in terms of having people take control of their own financial life in a way that benefits not just them but the entire economy and all of society. They’re an underground economy because they don’t trust the mainstream economy. Number one, a school district is a business.
Number of University Degrees in Science and Engineering 2000-2015 Source: National Science Board Science and Engineering Indicators A 2016 study from the World Economic Forum showed that China now produces more STEM graduates each year than any other country—4.7 million in 2016, for example, compared to only 568,000 in the U.S.
Number of University Degrees in Science and Engineering 2000-2015. A 2016 study from the World Economic Forum showed that China now produces more STEM graduates each year than any other country—4.7 million in 2016, for example, compared to only 568,000 in the U.S. and almost nine times the number of mobile payment users.
So, you’ll see that in this sort of what you might call a proto capitalistic society, interest is serving a number of different important functions. I mean, I cite a description of the failure of the Soviet economy. Even if you have a Soviet planned economy, you need to allocate resources across time. CHANCELLOR: Yes.
million miles of roads between 1996 and 2016 Between 2011 and 2013, China used more cement than the U.S. million miles of roads between 1996 and 2016 Between 2011 and 2013, China used more cement than the U.S. How much money would you put into this country's stock market? So how much better did China's stock market do versus ours?
We’ll examine how these companies shape the industry today, their market strategies, and their impact on consumers and the economy. Performance Highlights of Telecom Companies Reliance Jio Established in 2016 and headquartered in Navi Mumbai, has rapidly become India’s largest telecom operator.
The term was coined by the ex-RBI governor Raghuram Rajan in 2016 to simplify the effects of inflation on an individual’s purchasing power. Although quite a few of his decisions were unpopular, looking back they served in the best interests of the economy and curbing the rise of inflation. Keep reading to find out!!!
The oldest Millennials entered the workforce while the economy was booming. I remember when I entered the job market in the 70s (yes, I’m a boomer) we bemoaned our fate of being boomers because we were being spewed out of college and into the labor force in unprecedented numbers, driving competition for jobs up and wages down.
The Atlanta Falcons made the Super Bowl in 2016 with Matt Ryan at quarterback despite a cap hit of 15.4 There are ways for teams to juggle their cap numbers, of course. Until Patrick Mahomes the last two years (17.5% in 2024, 17.2% in 2023), no Super Bowl winning QB had a higher cap hit percentage than Steve Young.
We organize all of the trending information in your field so you don't have to. Join 36,000+ users and stay up to date on the latest articles your peers are reading.
You know about us, now we want to get to know you!
Let's personalize your content
Let's get even more personalized
We recognize your account from another site in our network, please click 'Send Email' below to continue with verifying your account and setting a password.


Let's personalize your content