This site uses cookies to improve your experience. To help us insure we adhere to various privacy regulations, please select your country/region of residence. If you do not select a country, we will assume you are from the United States. Select your Cookie Settings or view our Privacy Policy and Terms of Use.
Cookie Settings
Cookies and similar technologies are used on this website for proper function of the website, for tracking performance analytics and for marketing purposes. We and some of our third-party providers may use cookie data for various purposes. Please review the cookie settings below and choose your preference.
Used for the proper function of the website
Used for monitoring website traffic and interactions
Cookie Settings
Cookies and similar technologies are used on this website for proper function of the website, for tracking performance analytics and for marketing purposes. We and some of our third-party providers may use cookie data for various purposes. Please review the cookie settings below and choose your preference.
Strictly Necessary: Used for the proper function of the website
Performance/Analytics: Used for monitoring website traffic and interactions
. -- Airlines: Transportation Security Administration -- The TSA is providing daily travel numbers. This data shows the 7-day average of daily total traveler throughput from the TSA for 2019 (Light Blue), 2020 (Black), 2021 (Blue) and 2022 (Red). The dashed line is the percent of 2019 for the seven-day average. Blue is for 2020.
. -- Airlines: Transportation Security Administration -- The TSA is providing daily travel numbers. This data shows the 7-day average of daily total traveler throughput from the TSA for 2019 (Light Blue), 2020 (Black), 2021 (Blue) and 2022 (Red). The dashed line is the percent of 2019 for the seven-day average. Blue is for 2020.
. -- Airlines: Transportation Security Administration -- The TSA is providing daily travel numbers. This data shows the 7-day average of daily total traveler throughput from the TSA for 2019 (Light Blue), 2020 (Black), 2021 (Blue) and 2022 (Red). The dashed line is the percent of 2019 for the seven-day average. Blue is for 2020.
. -- Airlines: Transportation Security Administration -- The TSA is providing daily travel numbers. This data shows the 7-day average of daily total traveler throughput from the TSA for 2019 (Light Blue), 2020 (Black), 2021 (Blue) and 2022 (Red). The dashed line is the percent of 2019 for the seven-day average. Blue is for 2020.
. -- Airlines: Transportation Security Administration -- The TSA is providing daily travel numbers. This data shows the 7-day average of daily total traveler throughput from the TSA for 2019 (Light Blue), 2020 (Black), 2021 (Blue) and 2022 (Red). The dashed line is the percent of 2019 for the seven-day average. Blue is for 2020.
. -- Airlines: Transportation Security Administration -- The TSA is providing daily travel numbers. This data shows the 7-day average of daily total traveler throughput from the TSA for 2019 (Light Blue), 2020 (Black), 2021 (Blue) and 2022 (Red). The dashed line is the percent of 2019 for the seven-day average. Blue is for 2020.
. -- Airlines: Transportation Security Administration -- The TSA is providing daily travel numbers. This data shows the 7-day average of daily total traveler throughput from the TSA for 2019 (Light Blue), 2020 (Black), 2021 (Blue) and 2022 (Red). The dashed line is the percent of 2019 for the seven-day average. Blue is for 2020.
. -- Airlines: Transportation Security Administration -- The TSA is providing daily travel numbers. This data shows the 7-day average of daily total traveler throughput from the TSA for 2019 (Light Blue), 2020 (Black), 2021 (Blue) and 2022 (Red). The dashed line is the percent of 2019 for the seven-day average. Blue is for 2020.
. -- Airlines: Transportation Security Administration -- The TSA is providing daily travel numbers. This data shows the 7-day average of daily total traveler throughput from the TSA for 2019 (Light Blue), 2020 (Black), 2021 (Blue) and 2022 (Red). The dashed line is the percent of 2019 for the seven-day average. Blue is for 2020.
. -- Airlines: Transportation Security Administration -- The TSA is providing daily travel numbers. This data shows the 7-day average of daily total traveler throughput from the TSA for 2019 (Light Blue), 2020 (Black), 2021 (Blue) and 2022 (Red). The dashed line is the percent of 2019 for the seven-day average. Blue is for 2020.
. -- Airlines: Transportation Security Administration -- The TSA is providing daily travel numbers. This data shows the 7-day average of daily total traveler throughput from the TSA for 2019 (Light Blue), 2020 (Black), 2021 (Blue) and 2022 (Red). The dashed line is the percent of 2019 for the seven-day average. Blue is for 2020.
. -- Airlines: Transportation Security Administration -- The TSA is providing daily travel numbers. This data shows the 7-day average of daily total traveler throughput from the TSA for 2019 (Light Blue), 2020 (Black), 2021 (Blue) and 2022 (Red). The dashed line is the percent of 2019 for the seven-day average. Blue is for 2020.
. -- Airlines: Transportation Security Administration -- The TSA is providing daily travel numbers. This data shows the 7-day average of daily total traveler throughput from the TSA for 2019 (Light Blue), 2020 (Black), 2021 (Blue) and 2022 (Red). The dashed line is the percent of 2019 for the seven-day average. Blue is for 2020.
. -- Airlines: Transportation Security Administration -- The TSA is providing daily travel numbers. This data shows the 7-day average of daily total traveler throughput from the TSA for 2019 (Light Blue), 2020 (Black), 2021 (Blue) and 2022 (Red). The dashed line is the percent of 2019 for the seven-day average. Blue is for 2020.
. -- Airlines: Transportation Security Administration -- The TSA is providing daily travel numbers. This data shows the 7-day average of daily total traveler throughput from the TSA for 2019 (Light Blue), 2020 (Black), 2021 (Blue) and 2022 (Red). The dashed line is the percent of 2019 for the seven-day average. Blue is for 2020.
. -- Airlines: Transportation Security Administration -- The TSA is providing daily travel numbers. This data shows the 7-day average of daily total traveler throughput from the TSA for 2019 (Light Blue), 2020 (Black), 2021 (Blue) and 2022 (Red). The dashed line is the percent of 2019 for the seven-day average. Blue is for 2020.
. -- Airlines: Transportation Security Administration -- The TSA is providing daily travel numbers. This data shows the 7-day average of daily total traveler throughput from the TSA for 2019 (Light Blue), 2020 (Black), 2021 (Blue) and 2022 (Red). The dashed line is the percent of 2019 for the seven-day average. Blue is for 2020.
. -- Airlines: Transportation Security Administration -- The TSA is providing daily travel numbers. This data shows the 7-day average of daily total traveler throughput from the TSA for 2019 (Light Blue), 2020 (Black), 2021 (Blue) and 2022 (Red). The dashed line is the percent of 2019 for the seven-day average. Blue is for 2020.
. -- Airlines: Transportation Security Administration -- The TSA is providing daily travel numbers. This data shows the 7-day average of daily total traveler throughput from the TSA for 2019 (Light Blue), 2020 (Black), 2021 (Blue) and 2022 (Red). The dashed line is the percent of 2019 for the seven-day average. Blue is for 2020.
. -- Airlines: Transportation Security Administration -- The TSA is providing daily travel numbers. This data shows the 7-day average of daily total traveler throughput from the TSA for 2019 (Light Blue), 2020 (Black), 2021 (Blue) and 2022 (Red). The dashed line is the percent of 2019 for the seven-day average. Blue is for 2020.
. -- Airlines: Transportation Security Administration -- The TSA is providing daily travel numbers. This data shows the 7-day average of daily total traveler throughput from the TSA for 2019 (Light Blue), 2020 (Black), 2021 (Blue) and 2022 (Red). The dashed line is the percent of 2019 for the seven-day average. Blue is for 2020.
. -- Airlines: Transportation Security Administration -- The TSA is providing daily travel numbers. This data shows the 7-day average of daily total traveler throughput from the TSA for 2019 (Light Blue), 2020 (Black), 2021 (Blue) and 2022 (Red). The dashed line is the percent of 2019 for the seven-day average. Blue is for 2020.
We did see negative real GDP growth in Q1 and in Q2 - but that didn't mean the US economy was in a recession (and this has never been the definition of a US recession). And other measures of the economy were also positive, especially employment. I disagreed and noted I wasn't even on recession watch! And guess what?
Consider these columns going back to 2013 pointing out the foolishness of tax-payer subsidized corporate welfare queens (2013), and why median wages were rising ( 2016 , 2017 , 2018 , 2018 , 2019 ). By any measure, we still have an enormous number of unfilled positions. Then came the pandemic, and a huge federal worker subsidy.
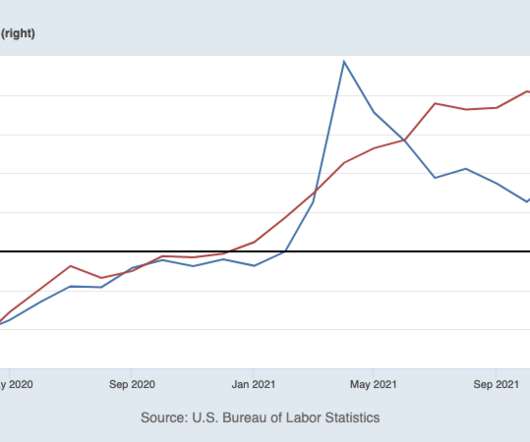
When I put together my list of what was to blame for inflation , corporate profit-seeking was number (13 of 15). price growth that characterized the pre-pandemic business cycle of 2007–2019. Generally speaking, high-profit margins are not a sign of an economy that is overheating. That was June; we now have a lot more data.
Well, in 2019, when your average money market fund was yielding zero and your average bond fund was yielding 2%, we used to scream, TINA — there is no alternative. And there’s a fair number of people who say 70%, two thirds of the stock market without any risk at all, market risk that is – sign me up for that.
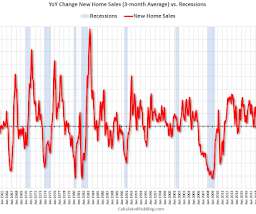
Two examples: not reaching a fiscal agreement and going off the "fiscal cliff" probably would have led to a recession, and Congress refusing to "pay the bills" would have been a policy error that would have taken the economy into recession. This has happened , but this usually leads the economy by a year or more.
institutionalinvestor.com) Amazon Amazon ($AMZN) is increasing the number of same-day shipping options. Sentencing Commission show judges rejected more than 80% of compassionate release requests filed from October 2019 through September 2022. (businessinsider.com) Airbnb ($ABNB) has a rating inflation problem.
If the economy remains strong (as we expect), that would matter much more than just about anything else. Here’s What the October Payroll Report Really Tells Us About the Economy October payrolls were a big disappointment, with job growth clocking in at just 12,000. The 2017-2019 pace was 3.1%.) on average, well above the 7.1%
Good news can be bad news in the short run, but a solid economy usually becomes good news again once we get past the initial market reaction. If the underlying economy is sound, pullbacks like this can actually be a positive for the longer-term health of the market. Monthly numbers can be noisy and so a 3-month average is helpful.
Fundamental changes are taking place in the labor economy, especially within the service sector. Immigrants used to fill the gap but we seem to have reduced the total number of legal immigrants over the past decade (some recent data suggests that’s improving). The post Help Wanted! appeared first on The Big Picture.
As an example, when the pandemic hit, I switched from being mostly positive on the economy to calling a recession in early March 2020. However, it seems unlikely that inventory will be back up to the 2017 - 2019 levels. As of August 2022, the total number of jobs had returned and are now 1.044 million above pre-pandemic levels.
April inflation data confirmed there is no need to panic about the first-quarter numbers. Despite the path of the economy, inflation, the election, geopolitics, or the Fed’s actions, what matters at the end of the day is what markets do. That’s the slowest pace since August 2021 and not far above the 2018-2019 average of 3.6%.
May job growth surprised to the upside with the economy adding a robust 272,000 jobs. How the consumer is tapped out, the economy is headed for a recession, only a few stocks are going up, and so on endlessly. We didn’t even see significant revisions to March and April payroll numbers, and the 3-month average now sits at 249,000.
The Equity Beat: Can the Swift Economy Remain on Stage? No less an authority on the economy than the Federal Reserve stated, “May was the strongest month for hotel revenue in Philadelphia since the onset of the pandemic, in large part due to an influx of guests for the Taylor Swift concerts in the city.” economy afloat this summer!
Optimism over lower taxes, a stronger economy, animal spirits, and strong earnings all were likely reasons for the surge. The economy created 227,000 jobs in November, close to expectations, which somewhat made up for the low 36,000 number in October (revised up from 12,000). For reference, the 2019 average was 166,000.
The economy has strong momentum, with growth accelerating since the first half of the year. Let’s Call It Like It Is: The Economy Is Strong, and There’s No Recession on the Horizon A year ago, a Bloomberg Economics model projected a recession within the next 12 months with 100% probability. Through June 2023, the economy grew 2.4%
As an example, when the pandemic hit, I switched from being mostly positive on the economy to calling a recession in early March 2020. The black line is for 2019. compared to the same week in 2019. Or will the economy lose jobs? "My Through November the economy has added 2.55 The red line is for 2023.
A “Goldilocks” December jobs report highlights sustained momentum for the economy as it continues its path to normalization. Goldilocks Job Numbers as Economy Powers Ahead The December payroll report was strong on the surface, with 216,000 jobs created last month and the unemployment rate firm at 3.7%. million, or 2.6
It is important to remember that stocks lead the economy, both on the way up and the way down. To us, this is the market’s way of saying the economy will continue to see solid growth next year. Stocks tend to lead the economy, and several major indexes are near new highs, which is a good signal for the economy.
The economy added 206,000 jobs in June, ahead of expectations of 190,000. That is the best ‘worst day of the month’ since November 2019 and second best since February 2017! Fortunately, the doers drive the economy; the thinkers only report on it. million, which matches the 2019 average. Doers are optimists.
This Bull Market Is Still Young As we’ve been saying for close to 18 months, we think we are in a new bull market and the economy will avoid a recession over the coming year. Stocks gained for the second week in a row, as strong earnings, a dovish Fed, and a “Goldilocks” job number sparked buying.
Good Riddance, February The second half of February was rough, as worries over the economy, tariffs, and large cap tech weakness dominated the conversation. We continue to think the bull market is alive and well and the economy is on solid footing, but that doesnt mean we wont have scary headlines or worries. Heres the thing.
The late week rebound was supported by better economic data, including some good jobs-related numbers. Markets Perked Up on Better Job Numbers The August 2 jobs report already had markets primed for a potentially volatile week after job gains came in much weaker than expected and the unemployment rate ticked up to 4.3%.
We organize all of the trending information in your field so you don't have to. Join 36,000+ users and stay up to date on the latest articles your peers are reading.
You know about us, now we want to get to know you!
Let's personalize your content
Let's get even more personalized
We recognize your account from another site in our network, please click 'Send Email' below to continue with verifying your account and setting a password.


Let's personalize your content