This site uses cookies to improve your experience. To help us insure we adhere to various privacy regulations, please select your country/region of residence. If you do not select a country, we will assume you are from the United States. Select your Cookie Settings or view our Privacy Policy and Terms of Use.
Cookie Settings
Cookies and similar technologies are used on this website for proper function of the website, for tracking performance analytics and for marketing purposes. We and some of our third-party providers may use cookie data for various purposes. Please review the cookie settings below and choose your preference.
Used for the proper function of the website
Used for monitoring website traffic and interactions
Cookie Settings
Cookies and similar technologies are used on this website for proper function of the website, for tracking performance analytics and for marketing purposes. We and some of our third-party providers may use cookie data for various purposes. Please review the cookie settings below and choose your preference.
Strictly Necessary: Used for the proper function of the website
Performance/Analytics: Used for monitoring website traffic and interactions
. -- Airlines: Transportation Security Administration -- The TSA is providing daily travel numbers. This data shows the 7-day average of daily total traveler throughput from the TSA for 2019 (Light Blue), 2020 (Black), 2021 (Blue) and 2022 (Red). Black is 2020, Blue is 2021 and Red is 2022. This data is as of September 11th.
. -- Airlines: Transportation Security Administration -- The TSA is providing daily travel numbers. This data shows the 7-day average of daily total traveler throughput from the TSA for 2019 (Light Blue), 2020 (Black), 2021 (Blue) and 2022 (Red). Black is 2020, Blue is 2021 and Red is 2022. This data is as of September 4th.
. -- Airlines: Transportation Security Administration -- The TSA is providing daily travel numbers. This data shows the 7-day average of daily total traveler throughput from the TSA for 2019 (Light Blue), 2020 (Black), 2021 (Blue) and 2022 (Red). Black is 2020, Blue is 2021 and Red is 2022. This data is as of November 6th.
. -- Airlines: Transportation Security Administration -- The TSA is providing daily travel numbers. This data shows the 7-day average of daily total traveler throughput from the TSA for 2019 (Light Blue), 2020 (Black), 2021 (Blue) and 2022 (Red). Black is 2020, Blue is 2021 and Red is 2022. This data is as of August 7th.
. -- Airlines: Transportation Security Administration -- The TSA is providing daily travel numbers. This data shows the 7-day average of daily total traveler throughput from the TSA for 2019 (Light Blue), 2020 (Black), 2021 (Blue) and 2022 (Red). Black is 2020, Blue is 2021 and Red is 2022. This data is as of September 25th.
. -- Airlines: Transportation Security Administration -- The TSA is providing daily travel numbers. This data shows the 7-day average of daily total traveler throughput from the TSA for 2019 (Light Blue), 2020 (Black), 2021 (Blue) and 2022 (Red). Black is 2020, Blue is 2021 and Red is 2022. This data is as of July 31st.
. -- Airlines: Transportation Security Administration -- The TSA is providing daily travel numbers. This data shows the 7-day average of daily total traveler throughput from the TSA for 2019 (Light Blue), 2020 (Black), 2021 (Blue) and 2022 (Red). Black is 2020, Blue is 2021 and Red is 2022. This data is as of August 21st.
. -- Airlines: Transportation Security Administration -- The TSA is providing daily travel numbers. This data shows the 7-day average of daily total traveler throughput from the TSA for 2019 (Light Blue), 2020 (Black), 2021 (Blue) and 2022 (Red). Black is 2020, Blue is 2021 and Red is 2022. This data is as of October 23rd.
. -- Airlines: Transportation Security Administration -- The TSA is providing daily travel numbers. This data shows the 7-day average of daily total traveler throughput from the TSA for 2019 (Light Blue), 2020 (Black), 2021 (Blue) and 2022 (Red). Black is 2020, Blue is 2021 and Red is 2022. This data is as of October 30th.
. -- Airlines: Transportation Security Administration -- The TSA is providing daily travel numbers. This data shows the 7-day average of daily total traveler throughput from the TSA for 2019 (Light Blue), 2020 (Black), 2021 (Blue) and 2022 (Red). Black is 2020, Blue is 2021 and Red is 2022. This data is as of August 28th.
. -- Airlines: Transportation Security Administration -- The TSA is providing daily travel numbers. This data shows the 7-day average of daily total traveler throughput from the TSA for 2019 (Light Blue), 2020 (Black), 2021 (Blue) and 2022 (Red). Black is 2020, Blue is 2021 and Red is 2022. This data is as of November 13th.
. -- Airlines: Transportation Security Administration -- The TSA is providing daily travel numbers. This data shows the 7-day average of daily total traveler throughput from the TSA for 2019 (Light Blue), 2020 (Black), 2021 (Blue) and 2022 (Red). Black is 2020, Blue is 2021 and Red is 2022. This data is as of October 15th.
. -- Airlines: Transportation Security Administration -- The TSA is providing daily travel numbers. This data shows the 7-day average of daily total traveler throughput from the TSA for 2019 (Light Blue), 2020 (Black), 2021 (Blue) and 2022 (Red). Black is 2020, Blue is 2021 and Red is 2022. This data is as of December 25th.
. -- Airlines: Transportation Security Administration -- The TSA is providing daily travel numbers. This data shows the 7-day average of daily total traveler throughput from the TSA for 2019 (Light Blue), 2020 (Black), 2021 (Blue) and 2022 (Red). Black is 2020, Blue is 2021 and Red is 2022. This data is as of December 4th.
. -- Airlines: Transportation Security Administration -- The TSA is providing daily travel numbers. This data shows the 7-day average of daily total traveler throughput from the TSA for 2019 (Light Blue), 2020 (Black), 2021 (Blue) and 2022 (Red). Black is 2020, Blue is 2021 and Red is 2022. This data is as of October 8th.
. -- Airlines: Transportation Security Administration -- The TSA is providing daily travel numbers. This data shows the 7-day average of daily total traveler throughput from the TSA for 2019 (Light Blue), 2020 (Black), 2021 (Blue) and 2022 (Red). Black is 2020, Blue is 2021 and Red is 2022. This data is as of August 14th.
. -- Airlines: Transportation Security Administration -- The TSA is providing daily travel numbers. This data shows the 7-day average of daily total traveler throughput from the TSA for 2019 (Light Blue), 2020 (Black), 2021 (Blue) and 2022 (Red). Black is 2020, Blue is 2021 and Red is 2022. This data is as of November 27th.
. -- Airlines: Transportation Security Administration -- The TSA is providing daily travel numbers. This data shows the 7-day average of daily total traveler throughput from the TSA for 2019 (Light Blue), 2020 (Black), 2021 (Blue) and 2022 (Red). Black is 2020, Blue is 2021 and Red is 2022. This data is as of July 24th.
railroads averaged 499,331 per week in October 2023, the most for any month since June 2021 — a span of 28 months. Part of the increase relates to intermodal seasonality and concerns over Panama Canal capacity, but part also reflects an economy that remains resilient. Carloads in 2021, 2022 and 2022: Total originated carloads on U.S.
. -- Airlines: Transportation Security Administration -- The TSA is providing daily travel numbers. This data shows the 7-day average of daily total traveler throughput from the TSA for 2019 (Light Blue), 2020 (Black), 2021 (Blue) and 2022 (Red). Black is 2020, Blue is 2021 and Red is 2022. This data is as of December 18th.
. -- Airlines: Transportation Security Administration -- The TSA is providing daily travel numbers. This data shows the 7-day average of daily total traveler throughput from the TSA for 2019 (Light Blue), 2020 (Black), 2021 (Blue) and 2022 (Red). Black is 2020, Blue is 2021 and Red is 2022. This data is as of December 11th.
. -- Airlines: Transportation Security Administration -- The TSA is providing daily travel numbers. This data shows the 7-day average of daily total traveler throughput from the TSA for 2019 (Light Blue), 2020 (Black), 2021 (Blue) and 2022 (Red). Black is 2020, Blue is 2021 and Red is 2022. This data is as of November 20th.
2) Employment: The economy added 4.5 million jobs added in 2021. Or will the economy lose jobs? Job losses in construction haven't started yet because a record number of housing units are under construction. If the Fed drives the economy into recession (to cool inflation), then we could see job losses in 2023.
. -- Airlines: Transportation Security Administration -- The TSA is providing daily travel numbers. This data shows the 7-day average of daily total traveler throughput from the TSA for 2019 (Light Blue), 2020 (Black), 2021 (Blue) and 2022 (Red). Black is 2020, Blue is 2021 and Red is 2022. This data is as of October 2nd.
Sure, RRE/CRE is a huge part of the economy, so its health is always important. But for the purposes of our discussion about the state of the economy and rising interest rates, Real Estate is where the rubber meets the road. Previously : How Everybody Miscalculated Housing Demand (July 29, 2021).
There will be plenty of "gray hairs" walking around in 2030, but the key for the economy is the population in the prime working age group is now increasing. And below is a table showing the ten most common ages in 2010, 2021, and 2030 (projections are from the Census Bureau, 2017 ). And this is a positive for the economy.
By any measure, we still have an enormous number of unfilled positions. This attests to the robustness of the labor economy, recession or not. In other words, the Great Resignation was mostly in 2021, but the after-effects are still being felt today even after Quit rates normalized. Wages in America.
We did see negative real GDP growth in Q1 and in Q2 - but that didn't mean the US economy was in a recession (and this has never been the definition of a US recession). And other measures of the economy were also positive, especially employment. I disagreed and noted I wasn't even on recession watch! And guess what?
Two examples: not reaching a fiscal agreement and going off the "fiscal cliff" probably would have led to a recession, and Congress refusing to "pay the bills" would have been a policy error that would have taken the economy into recession. This has happened , but this usually leads the economy by a year or more.
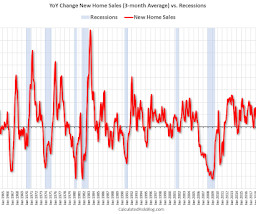
I am not sure if they quite recognize the potential damage they are doing to the economy. Lack of Single Family Homes : We’ve discussed this before most notably in 2021, but home builders have wildly underbuilt the number of houses relative to population growth following the financial crisis (GFC).
Two examples: not reaching a fiscal agreement and going off the "fiscal cliff" probably would have led to a recession, and Congress refusing to "pay the bills" would have been a policy error that would have taken the economy into recession. My sense is growth will stay sluggish in 2023, but the economy will avoid recession.
Fundamental changes are taking place in the labor economy, especially within the service sector. Immigrants used to fill the gap but we seem to have reduced the total number of legal immigrants over the past decade (some recent data suggests that’s improving). The post Help Wanted! appeared first on The Big Picture.
As an example, when the pandemic hit, I switched from being mostly positive on the economy to calling a recession in early March 2020. year-over-year in November compared to November 2021. Price appreciation will decrease from the unsustainable 2021 pace but seems likely to still be in the mid-to-high single digit range in 2022."
This was an out-of-the-consensus call and helped me call the bottom for the US economy in mid-2009. This graph shows the total number of registered vehicles in the U.S. This graph shows the total number of registered vehicles in the U.S. Note: the number of registered vehicles is estimated for 2021 and 2022.
Today, the Producer Price Index and Consumer Retail Sales both showed the economy is decelerating and not on an inflation-adjusted basis. There is not a lot the Fed can do to increase the number of workers, create more single-family homes, end the Russian war in Ukraine, produce more semiconductors, or untangle snarled supply chains.
The problem is that most of the time, those are bad reasons… Source: Irrelevant Investor Previously : One-Sided Markets (September 29, 2021) Is Partisanship Driving Consumer Sentiment? Consider : – Unemployment at 3.4%
And there’s a fair number of people who say 70%, two thirds of the stock market without any risk at all, market risk that is – sign me up for that. And what you saw in 2021 and 2022 is transitory inflation that got us to 9 percent on CPI. It’s a number that’s put out every Thursday for the previous week.
After a monstrous 68% recovery from the March 2020 pandemic low, and another nearly 30% gain in 2021, markets decided to have one of their all-too-regular spasms. Were you a late FOMO buyer in 2021? are fast-growing, highly profitable key players in the modern economy. Blame whatever you want – Too far, too fast? End of ZIRP?
It is one of those round numbers that people just kinda made up and started with for no apparent reason. But the 2% inflation target is LITERALLY a random number 2 that originated in New Zealand in the 1980s. The economy was sluggish, job creation as weak, consumer spending was soft. Their PTSD is palpable.
And THAT is what led to the giant inflation spike of 2021 and 22. So, the Fed needs to have a sense of where things are headed with inflation — because rates are a tool that takes a little bit for it to work its way through the economy. It was a kind of slow burn on the economy. On its way up to just about 9%.
If the economy remains strong (as we expect), that would matter much more than just about anything else. Here’s What the October Payroll Report Really Tells Us About the Economy October payrolls were a big disappointment, with job growth clocking in at just 12,000. But those numbers are backward looking.
As we lap the surge in inventory that occurred in 2022 as higher mortgage rates priced out many home shoppers, the number of homes for sale is not keeping up. The number of newly listed homes has been lower than the same time the previous year for the past 52 weeks–an entire year. Inventory was down 2.1%
Early Benchmark Methodology Preliminary (not-yet-benchmarked) state employment estimates from the Bureau of Labor Statistics (BLS) continue to be subject to significant revisions around turning points in the economy. The QCEW data for October, November, and December 2021 were released on June 8, 2022. Q&A What's Going On?
2 The current move from 2021 highs is shown in red. Meaning, you do not get the 8-10% long-term gains without living through a significant number of market events, ranging from cyclical drawdowns to longer secular bear markets, and full-on crashes.
We organize all of the trending information in your field so you don't have to. Join 36,000+ users and stay up to date on the latest articles your peers are reading.
You know about us, now we want to get to know you!
Let's personalize your content
Let's get even more personalized
We recognize your account from another site in our network, please click 'Send Email' below to continue with verifying your account and setting a password.


Let's personalize your content