This site uses cookies to improve your experience. To help us insure we adhere to various privacy regulations, please select your country/region of residence. If you do not select a country, we will assume you are from the United States. Select your Cookie Settings or view our Privacy Policy and Terms of Use.
Cookie Settings
Cookies and similar technologies are used on this website for proper function of the website, for tracking performance analytics and for marketing purposes. We and some of our third-party providers may use cookie data for various purposes. Please review the cookie settings below and choose your preference.
Used for the proper function of the website
Used for monitoring website traffic and interactions
Cookie Settings
Cookies and similar technologies are used on this website for proper function of the website, for tracking performance analytics and for marketing purposes. We and some of our third-party providers may use cookie data for various purposes. Please review the cookie settings below and choose your preference.
Strictly Necessary: Used for the proper function of the website
Performance/Analytics: Used for monitoring website traffic and interactions
Earliler the Census Bureau released the population estimates for July 2022 by age, and I've updated the table from the previous post. The table below shows the top 10 cohorts by size for 2010, 2022 (released recently), and the most recent Census Bureau projections for 2030. population by age in July 2022 according to the Census Bureau.
. -- Airlines: Transportation Security Administration -- The TSA is providing daily travel numbers. This data shows the 7-day average of daily total traveler throughput from the TSA for 2019 (Light Blue), 2020 (Black), 2021 (Blue) and 2022 (Red). Black is 2020, Blue is 2021 and Red is 2022. This data is as of September 11th.
. -- Airlines: Transportation Security Administration -- The TSA is providing daily travel numbers. This data shows the 7-day average of daily total traveler throughput from the TSA for 2019 (Light Blue), 2020 (Black), 2021 (Blue) and 2022 (Red). Black is 2020, Blue is 2021 and Red is 2022. This data is as of August 7th.
. -- Airlines: Transportation Security Administration -- The TSA is providing daily travel numbers. This data shows the 7-day average of daily total traveler throughput from the TSA for 2019 (Light Blue), 2020 (Black), 2021 (Blue) and 2022 (Red). Black is 2020, Blue is 2021 and Red is 2022. This data is as of July 31st.
. -- Airlines: Transportation Security Administration -- The TSA is providing daily travel numbers. This data shows the 7-day average of daily total traveler throughput from the TSA for 2019 (Light Blue), 2020 (Black), 2021 (Blue) and 2022 (Red). Black is 2020, Blue is 2021 and Red is 2022. This data is as of September 4th.
. -- Airlines: Transportation Security Administration -- The TSA is providing daily travel numbers. This data shows the 7-day average of daily total traveler throughput from the TSA for 2019 (Light Blue), 2020 (Black), 2021 (Blue) and 2022 (Red). Black is 2020, Blue is 2021 and Red is 2022. This data is as of November 6th.
. -- Airlines: Transportation Security Administration -- The TSA is providing daily travel numbers. This data shows the 7-day average of daily total traveler throughput from the TSA for 2019 (Light Blue), 2020 (Black), 2021 (Blue) and 2022 (Red). Black is 2020, Blue is 2021 and Red is 2022. This data is as of September 25th.
At the end of each year, I post Ten Economic Questions for the following year (2022). As an example, when the pandemic hit, I switched from being mostly positive on the economy to calling a recession in early March 2020. Here is a graph from Realtor.com showing active inventory through November 2022. This was correct.
. -- Airlines: Transportation Security Administration -- The TSA is providing daily travel numbers. This data shows the 7-day average of daily total traveler throughput from the TSA for 2019 (Light Blue), 2020 (Black), 2021 (Blue) and 2022 (Red). Black is 2020, Blue is 2021 and Red is 2022. This data is as of August 21st.
. -- Airlines: Transportation Security Administration -- The TSA is providing daily travel numbers. This data shows the 7-day average of daily total traveler throughput from the TSA for 2019 (Light Blue), 2020 (Black), 2021 (Blue) and 2022 (Red). Black is 2020, Blue is 2021 and Red is 2022. This data is as of October 23rd.
. -- Airlines: Transportation Security Administration -- The TSA is providing daily travel numbers. This data shows the 7-day average of daily total traveler throughput from the TSA for 2019 (Light Blue), 2020 (Black), 2021 (Blue) and 2022 (Red). Black is 2020, Blue is 2021 and Red is 2022. This data is as of October 30th.
. -- Airlines: Transportation Security Administration -- The TSA is providing daily travel numbers. This data shows the 7-day average of daily total traveler throughput from the TSA for 2019 (Light Blue), 2020 (Black), 2021 (Blue) and 2022 (Red). Black is 2020, Blue is 2021 and Red is 2022. This data is as of August 28th.
. -- Airlines: Transportation Security Administration -- The TSA is providing daily travel numbers. This data shows the 7-day average of daily total traveler throughput from the TSA for 2019 (Light Blue), 2020 (Black), 2021 (Blue) and 2022 (Red). Black is 2020, Blue is 2021 and Red is 2022. This data is as of November 13th.
. -- Airlines: Transportation Security Administration -- The TSA is providing daily travel numbers. This data shows the 7-day average of daily total traveler throughput from the TSA for 2019 (Light Blue), 2020 (Black), 2021 (Blue) and 2022 (Red). Black is 2020, Blue is 2021 and Red is 2022. This data is as of October 15th.
. -- Airlines: Transportation Security Administration -- The TSA is providing daily travel numbers. This data shows the 7-day average of daily total traveler throughput from the TSA for 2019 (Light Blue), 2020 (Black), 2021 (Blue) and 2022 (Red). Black is 2020, Blue is 2021 and Red is 2022. This data is as of December 25th.
. -- Airlines: Transportation Security Administration -- The TSA is providing daily travel numbers. This data shows the 7-day average of daily total traveler throughput from the TSA for 2019 (Light Blue), 2020 (Black), 2021 (Blue) and 2022 (Red). Black is 2020, Blue is 2021 and Red is 2022. This data is as of December 4th.
. -- Airlines: Transportation Security Administration -- The TSA is providing daily travel numbers. This data shows the 7-day average of daily total traveler throughput from the TSA for 2019 (Light Blue), 2020 (Black), 2021 (Blue) and 2022 (Red). Black is 2020, Blue is 2021 and Red is 2022. This data is as of October 8th.
. -- Airlines: Transportation Security Administration -- The TSA is providing daily travel numbers. This data shows the 7-day average of daily total traveler throughput from the TSA for 2019 (Light Blue), 2020 (Black), 2021 (Blue) and 2022 (Red). Black is 2020, Blue is 2021 and Red is 2022. This data is as of August 14th.
. -- Airlines: Transportation Security Administration -- The TSA is providing daily travel numbers. This data shows the 7-day average of daily total traveler throughput from the TSA for 2019 (Light Blue), 2020 (Black), 2021 (Blue) and 2022 (Red). Black is 2020, Blue is 2021 and Red is 2022. This data is as of July 24th.
. -- Airlines: Transportation Security Administration -- The TSA is providing daily travel numbers. This data shows the 7-day average of daily total traveler throughput from the TSA for 2019 (Light Blue), 2020 (Black), 2021 (Blue) and 2022 (Red). Black is 2020, Blue is 2021 and Red is 2022. This data is as of November 27th.
. -- Airlines: Transportation Security Administration -- The TSA is providing daily travel numbers. This data shows the 7-day average of daily total traveler throughput from the TSA for 2019 (Light Blue), 2020 (Black), 2021 (Blue) and 2022 (Red). Black is 2020, Blue is 2021 and Red is 2022. This data is as of December 18th.
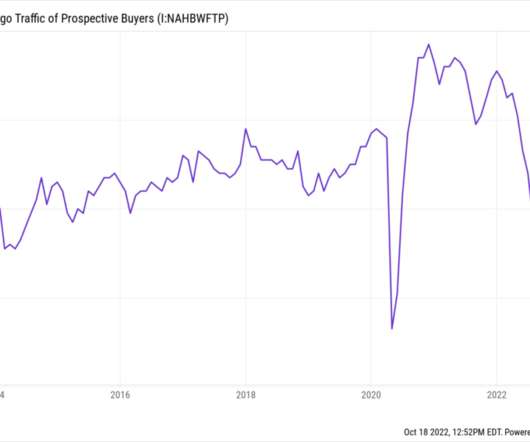
About a quarter of the October 2022 slides were focused on real estate. Sure, RRE/CRE is a huge part of the economy, so its health is always important. But for the purposes of our discussion about the state of the economy and rising interest rates, Real Estate is where the rubber meets the road. This is atypical.
2) Employment: The economy added 4.5 million jobs in 2022. This makes 2022 the second-best year for job growth in US history, only behind the 6.7 Or will the economy lose jobs? Job losses in construction haven't started yet because a record number of housing units are under construction. million jobs added in 2021.
. -- Airlines: Transportation Security Administration -- The TSA is providing daily travel numbers. This data shows the 7-day average of daily total traveler throughput from the TSA for 2019 (Light Blue), 2020 (Black), 2021 (Blue) and 2022 (Red). Black is 2020, Blue is 2021 and Red is 2022. This data is as of December 11th.
. -- Airlines: Transportation Security Administration -- The TSA is providing daily travel numbers. This data shows the 7-day average of daily total traveler throughput from the TSA for 2019 (Light Blue), 2020 (Black), 2021 (Blue) and 2022 (Red). Black is 2020, Blue is 2021 and Red is 2022. This data is as of November 20th.
This week, we speak with Kyla Scanlon , creator, host of YouTube’s,“Let’s Appreciate” podcast , writer of daily short-form videos about economy + markets. Her new book “ In This Economy?: Cutter has put-up impressive numbers since its 2022 launch, and now manages more than $500 million in institutional assets.
What I have instead are questions about what the rest of 2022 looks like, and how deep into 2023 any damage persists. How much will the economy slow in Q3 and Q4? How much will the economy slow in Q3 and Q4? The economy, corporate revenues, earnings, and consumer spending are to some degree path dependent.
When I put together my list of what was to blame for inflation , corporate profit-seeking was number (13 of 15). Generally speaking, high-profit margins are not a sign of an economy that is overheating. Economic Policy Institute, April 21, 2022). The truth about inflation (Popular Information, November 7, 2022).
. -- Airlines: Transportation Security Administration -- The TSA is providing daily travel numbers. This data shows the 7-day average of daily total traveler throughput from the TSA for 2019 (Light Blue), 2020 (Black), 2021 (Blue) and 2022 (Red). Black is 2020, Blue is 2021 and Red is 2022. This data is as of October 2nd.
Together they paint a fascinating picture of an economy robust enough to withstand the fastest set of rate increases in history, but also one that is showing signs of slowing. Previously : The Tide of Price over Volume (April 21, 2023) Signs of Softening (July 29, 2022) Are We in a Recession? (No)
ft.com) The 2022 fundraising scene is completely different than the prior 11 years. cbsnews.com) Economy Is crude oil losing its salience as an economic indicator? awealthofcommonsense.com) What falling tax withholding numbers say about the state of the economy. wapo.st) How long will consumer spending hold up?
By any measure, we still have an enormous number of unfilled positions. This attests to the robustness of the labor economy, recession or not. See also : Millions of Americans Regret the Great Resignation ( Bloomberg , July 12, 2022). Previously : Who Is to Blame for Inflation, 1-15 (June 28, 2022). Wages in America.
Lists 9 surprising things that happened in 2022 including 'The Federal Reserve opening pushed for the stock market to fall.' awealthofcommonsense.com) 4 mistakes from 2022 including the idea of more funds equaling more diversification. morningstar.com) 35 ideas from 2022 including 'Long term investing is hard.'
Today, the Producer Price Index and Consumer Retail Sales both showed the economy is decelerating and not on an inflation-adjusted basis. There is not a lot the Fed can do to increase the number of workers, create more single-family homes, end the Russian war in Ukraine, produce more semiconductors, or untangle snarled supply chains.
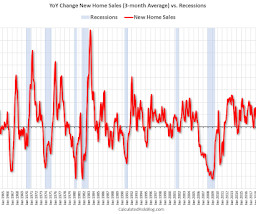
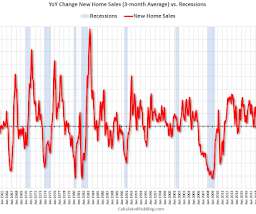
Two examples: not reaching a fiscal agreement and going off the "fiscal cliff" probably would have led to a recession, and Congress refusing to "pay the bills" would have been a policy error that would have taken the economy into recession. In 2022, both new home sales and single-family starts turned down in response to higher mortgage rates.
The recession callers were back in the first half of 2022, and some like ARK's Cathie Wood and Home Depot's Ken Langone claimed the US was already in a recession. We did see negative real GDP growth in Q1 and in Q2 - but that didn't mean the US economy was in a recession (and this has never been the definition of a US recession).
People often talk about "the economy" as a single entity whose parts move in unison, with a small number of key indicators (such as GDP, the unemployment rate, and inflation) moving reliably in relation to each other. manufacturing sector, by the measures of employment and service prices, has been in a recession for nearly 12 months.
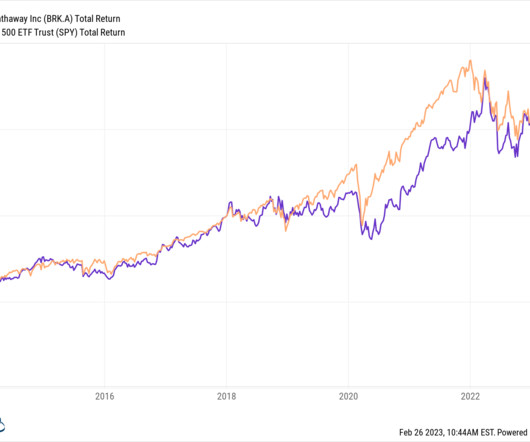
tker.co) A link to the 2022 Berkshire Hathaway ($BRK.A) institutionalinvestor.com) Amazon Amazon ($AMZN) is increasing the number of same-day shipping options. Sentencing Commission show judges rejected more than 80% of compassionate release requests filed from October 2019 through September 2022. annual shareholder report.
The recession callers were back in the first half of 2022, and some like ARK's Cathie Wood and Home Depot's Ken Langone claimed the US was already in a recession. See my post in 2019: Don't Freak Out about the Yield Curve ) For the economy, what I focus on is single family starts and new home sales. My answer is: Maybe.
It is one of those round numbers that people just kinda made up and started with for no apparent reason. But the 2% inflation target is LITERALLY a random number 2 that originated in New Zealand in the 1980s. The economy was sluggish, job creation as weak, consumer spending was soft. Their PTSD is palpable.
If anything, it feels like the Fed wants to fight us, all of us, including the stock market and the economy. The Fed is actively trying to crash the stock market, break the housing market and push the economy into a recession. A Very Tough Year : The S&P 500 has declined more than 1% in one out of four days so far in 2022.
Early Benchmark Revisions of State Payroll Employment Please consider Early Benchmarks for All 50 States and the District of Columbia for the second quarter of 2022. Payroll jobs in the nation remained essentially flat from March through June 2022 after adjusting for QCEW data. employment for the bulk of 2022.
You’ll remember as I came into the Fed, I started the very beginning of, of 2023 in December of 2022. The supply side was healing on the supply chain, and there was a big surge of labor force participation from a number of groups. I think number one. Yeah, Barry, thanks for having me on. Look, I called the Golden Path.
Here is a quick mental exercise to allow you to operate without your hindsight bias getting in the way: At the end of 2022, an all-knowing market deity visits to inform you that almost halfway through the year, 1) Rates will be appreciably higher; 2) Three of the biggest bank failures in U.S. Consider : – Unemployment at 3.4%
We organize all of the trending information in your field so you don't have to. Join 36,000+ users and stay up to date on the latest articles your peers are reading.
You know about us, now we want to get to know you!
Let's personalize your content
Let's get even more personalized
We recognize your account from another site in our network, please click 'Send Email' below to continue with verifying your account and setting a password.


Let's personalize your content