This site uses cookies to improve your experience. To help us insure we adhere to various privacy regulations, please select your country/region of residence. If you do not select a country, we will assume you are from the United States. Select your Cookie Settings or view our Privacy Policy and Terms of Use.
Cookie Settings
Cookies and similar technologies are used on this website for proper function of the website, for tracking performance analytics and for marketing purposes. We and some of our third-party providers may use cookie data for various purposes. Please review the cookie settings below and choose your preference.
Used for the proper function of the website
Used for monitoring website traffic and interactions
Cookie Settings
Cookies and similar technologies are used on this website for proper function of the website, for tracking performance analytics and for marketing purposes. We and some of our third-party providers may use cookie data for various purposes. Please review the cookie settings below and choose your preference.
Strictly Necessary: Used for the proper function of the website
Performance/Analytics: Used for monitoring website traffic and interactions
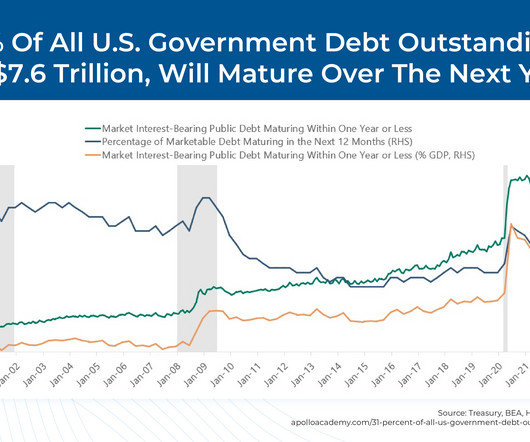
Fed's Beige Book Economic activity increased slightly to moderately across the twelve Federal Reserve Districts in late November and December. Manufacturing decreased slightly on net, and a number of Districts said manufacturers were stockpiling inventories in anticipation of higher tariffs. Vehicle sales grew modestly.
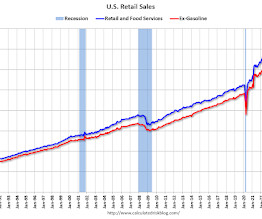
For manufacturing, the February Industrial Production report and the March NY and Philly Fed manufacturing surveys will be released. -- Monday, March 17th -- 8:30 AM: Retail sales for February is scheduled to be released. 8:30 AM: The New York Fed Empire State manufacturing survey for March. The consensus is for a 0.7%
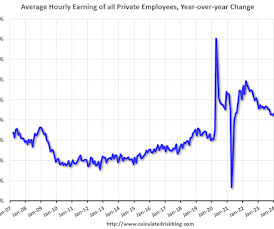
The headline jobs number in the July employment report was well above expectations, and employment for the previous two months was revised up by 28,000, combined. Manufacturing added 30 thousand jobs and is now 41 thousand above the pre-pandemic level. Earlier: July Employment Report: 528 thousand Jobs, 3.5% million jobs.
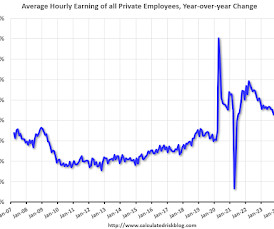
People often talk about "the economy" as a single entity whose parts move in unison, with a small number of key indicators (such as GDP, the unemployment rate, and inflation) moving reliably in relation to each other. manufacturing sector, by the measures of employment and service prices, has been in a recession for nearly 12 months.
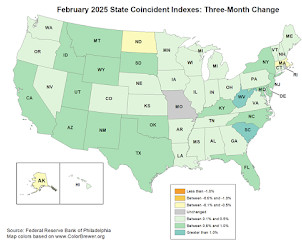
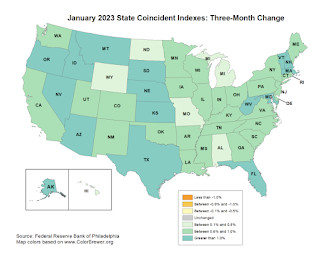
An explanation from the Philly Fed: The coincident indexes combine four state-level indicators to summarize current economic conditions in a single statistic. And here is a graph is of the number of states with one month increasing activity according to the Philly Fed. city average). The map is mostly positive on a three-month basis.
An explanation from the Philly Fed: The coincident indexes combine four state-level indicators to summarize current economic conditions in a single statistic. And here is a graph is of the number of states with one month increasing activity according to the Philly Fed. city average). The map is mostly positive on a three-month basis.
The headline jobs number in the October employment report was above expectations, and employment for the previous two months was revised up by 29,000, combined. Manufacturing added 32 thousand jobs and is now 137 thousand above the pre-pandemic level. The participation rate decreased, and the unemployment rate increased to 3.7%.
The headline jobs number in the December employment report was above expectations, however employment for the previous two months was revised down by 28,000, combined. Manufacturing added 8 thousand jobs and is now 149 thousand above the pre-pandemic level. Earlier: December Employment Report: 223 thousand Jobs, 3.5% million jobs.
The headline jobs number in the January employment report was well above expectations, and employment for the previous two months was revised up by 71,000, combined. Manufacturing added 19 thousand jobs and is now 214 thousand above the pre-pandemic level. With revisions: The 4.81 million jobs. million, was little changed in January.
The headline jobs number in the May employment report was well above expectations, however March and April payrolls were revised down by 15,000 combined. Manufacturing employment increased 8 thousand and is now 185 thousand above the pre-pandemic level. The number of persons working part time for economic reasons decreased in May to 4.42
The headline jobs number in the April employment report was below expectations, and February and March payrolls were revised down by 22,000 combined. Manufacturing employment increased 8 thousand and is now 181 thousand above the pre-pandemic level. The number of persons working part time for economic reasons increased in April to 4.47
The headline jobs number in the April employment report was above expectations, however employment for the previous two months was revised down by 149,000, combined. Manufacturing employment increased 11 thousand jobs and is now 206 thousand above the pre-pandemic level. Earlier: April Employment Report: 253 thousand Jobs, 3.4%
The headline jobs number in the July employment report was below expectations, and May and June payrolls were revised down by 29,000 combined. Manufacturing employment increased 1 thousand and is now 173 thousand above the pre-pandemic level. The number of persons working part time for economic reasons increased in July to 4.57
The sentiment is especially poignant when it comes to economic forecasting, as it's nearly impossible to get an accurate picture of the current state of the economy at any given moment. While the manufacturing sector (which makes up 'only' 8% of the U.S.
The headline jobs number in the June employment report was at expectations, however, employment for the previous two months was revised down by 110,000, combined. Manufacturing employment increased 7 thousand jobs and is now 204 thousand above the pre-pandemic level. Leisure and hospitality gained 21 thousand jobs in June.
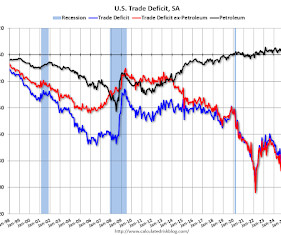
Other key indicators include the October Trade Deficit, the November ISM manufacturing index and November vehicle sales. -- Monday, December 2nd -- 10:00 AM: ISM Manufacturing Index for November. The number of job openings (black) were down 20% year-over-year. The key report this week is the November employment report on Friday.
The headline jobs number in the November employment report was above expectations, however employment for the previous two months was revised down by 23,000, combined. Manufacturing added 14 thousand jobs and is now 149 thousand above the pre-pandemic level. Leisure and hospitality gained 88 thousand jobs in November. million jobs.
Flash US Manufacturing Output Index at 47.2 Flash US Manufacturing PMI at 47.6 The PMI numbers are diffusion indexes. Lower output was seen across both manufacturing and service sectors amid increasingly steep downturns in demand. Key Findings Flash US PMI Composite Output Index at 46.3 October: 48.2). 3-month low.
For manufacturing, August Industrial Production, and the September New York and Philly Fed surveys will be released this week. The FOMC meets this week and is expected to cut rates. -- Monday, September 16th -- 8:30 AM ET: The New York Fed Empire State manufacturing survey for September. The consensus is for a reading of -4.0,
The headline jobs number in the September employment report was well above expectations, and July and August payrolls were revised up by 72,000 combined. Manufacturing employment decreased 7 thousand and is now 137 thousand above the pre-pandemic level. Earlier: September Employment Report: 254 thousand Jobs, 4.1% YoY in September.
The headline jobs number in the March employment report was above expectations; and January and February payrolls were revised up by 22,000 combined. Manufacturing employment was unchanged and is now 176 thousand above the pre-pandemic level. The number of persons working part time for economic reasons decreased in March to 4.31
The headline jobs number in the February employment report was above expectations, however employment for the previous two months was revised down by 34,000, combined. Manufacturing lost 4 thousand jobs and is now 198 thousand above the pre-pandemic level. The participation rate increased, and the unemployment rate increased to 3.6%.
The headline jobs number in the September employment report was well above expectations, and employment for the previous two months was revised up by 119,000, combined. Manufacturing employment increased 17 thousand jobs and is now 226 thousand above the pre-pandemic level. Earlier: September Employment Report: 336 thousand Jobs, 3.8%
The headline jobs number in the August employment report was at expectations, however, employment for the previous two months was revised down by 110,000, combined. Manufacturing employment increased 16 thousand jobs and is now 212 thousand above the pre-pandemic level. Earlier: August Employment Report: 187 thousand Jobs, 3.8%
The headline jobs number in the August employment report was below expectations, and June and July payrolls were revised down by 82,000 combined. Manufacturing employment decreased 24 thousand and is now 147 thousand above the pre-pandemic level. The number of persons working part time for economic reasons increased in August to 4.83
The headline jobs number in the October employment report was below expectations, and employment for the previous two months was revised down by 101,000, combined. Manufacturing employment decreased 35 thousand jobs and is now 175 thousand above the pre-pandemic level. Leisure and hospitality gained 19 thousand jobs in October.
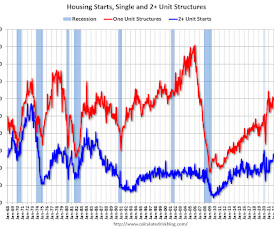
Contacts from most Districts indicated economic growth was modest during July and August. Manufacturing contacts in several Districts also noted that supply chain delays improved, and that they were better able to meet existing orders. One sector where supply did not become more available was single-family housing.
The key economic reports this week are Retail Sales, Housing Starts, Existing Home Sales, the 3rd estimate of Q3 GDP, and November Personal income and outlays. For manufacturing, November Industrial Production, and the December New York, Philly and Kansas City Fed surveys will be released this week. The consensus is for a reading of 5.8,
The headline jobs number in the November employment report was at expectations, however employment for the previous two months was revised down by 35,000, combined. Manufacturing employment increased 28 thousand jobs and is now 200 thousand above the pre-pandemic level. Leisure and hospitality gained 40 thousand jobs in November.
For manufacturing, the December Industrial Production report and the January New York and Philly Fed manufacturing surveys will be released. -- Monday, January 16th -- All US markets will be closed in observance of Martin Luther King Jr. Any number below 50 indicates that more builders view sales conditions as poor than good.
The headline jobs number in the December employment report was above expectations, however employment for the previous two months was revised down by 71,000, combined. Manufacturing employment increased 6 thousand jobs and is now 201 thousand above the pre-pandemic level. Leisure and hospitality gained 40 thousand jobs in December.
The key economic reports this week are October Retail Sales, Housing Starts and Existing Home sales. 8:30 AM: The New York Fed Empire State manufacturing survey for November. Any number below 50 indicates that more builders view sales conditions as poor than good. 8:30 AM: the Philly Fed manufacturing survey for November.
The key reports this week are March Housing Starts and Existing Home Sales. -- Monday, April 17th -- 8:30 AM: The New York Fed Empire State manufacturing survey for April. Any number below 50 indicates that more builders view sales conditions as poor than good. -- Tuesday, April 18th -- 8:30 AM ET: Housing Starts for March.
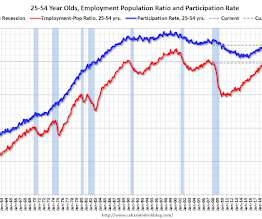
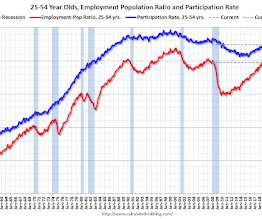
The headline jobs number in the September employment report was slightly above expectations, and employment for the previous two months was revised up by 11,000, combined. Manufacturing added 22 thousand jobs and is now 163 thousand above the pre-pandemic level. And the employment-population ratio was unchanged. million in September.
(marginalrevolution.com) Global Home ownership is out of reach for an increasing number of Australians. nytimes.com) Economy The economic graph of 2023. bonddad.blogspot.com) The American manufacturing economy is bumping along. wsj.com) The economic schedule for the coming week. npr.org) Human population may soon peak.
The headline jobs number in the March employment report was close to expectations, however employment for the previous two months was revised down by 17,000, combined. Manufacturing lost 1 thousand jobs and is now 198 thousand above the pre-pandemic level. Leisure and hospitality gained 72 thousand jobs in March. million jobs.
The headline jobs number in the July employment report was slightly below expectations, however, employment for the previous two months was revised down by 49,000, combined. Manufacturing employment decreased 2 thousand jobs and is now 200 thousand above the pre-pandemic level. Leisure and hospitality gained 17 thousand jobs in July.
Rather than accept the volatility of month-to-month economic datapoints — NFP, Consumer Spending, Manufacturing, Inflation, etc. Instead, there is a tendency to put too much weight onto the numbers themselves, encouraging a variety of changes and modifications to portfolios due to whatever the latest data suggests.
For manufacturing, the June Industrial Production report and the July New York and Philly Fed manufacturing surveys will be released. -- Monday, July 15th -- 8:30 AM: The New York Fed Empire State manufacturing survey for July. 8:30 AM: the Philly Fed manufacturing survey for July. The consensus is for a reading of -6.0,
The headline jobs number in the June employment report was above expectations, however April and May payrolls were revised down by 111,000 combined. Manufacturing employment decreased 8 thousand and is now 170 thousand above the pre-pandemic level. The number of persons working part time for economic reasons decreased in June to 4.22
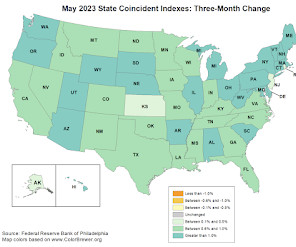
An explanation from the Philly Fed: The coincident indexes combine four state-level indicators to summarize current economic conditions in a single statistic. And here is a graph is of the number of states with one month increasing activity according to the Philly Fed. city average). The map is all positive on a three-month basis.
An explanation from the Philly Fed: The coincident indexes combine four state-level indicators to summarize current economic conditions in a single statistic. And here is a graph is of the number of states with one month increasing activity according to the Philly Fed. city average). The map is all positive on a three-month basis.
How should investors view the relationship between trade policy and inflation in the current economic environment? Gwinn Professor of Economics Masters in Business (coming soon) ~~~ Find all of the previous At the Money episodes here , and in the MiB feed on Apple Podcasts , YouTube , Spotify , and Bloomberg. What was it about?
The headline jobs number in the January employment report was well above expectations, and November and December payrolls were revised up by 126,000 combined. Manufacturing employment increased 23 thousand jobs and is now 199 thousand above the pre-pandemic level. Including revisions: The 3.06 million, changed little. million from 4.21
We organize all of the trending information in your field so you don't have to. Join 36,000+ users and stay up to date on the latest articles your peers are reading.
You know about us, now we want to get to know you!
Let's personalize your content
Let's get even more personalized
We recognize your account from another site in our network, please click 'Send Email' below to continue with verifying your account and setting a password.


Let's personalize your content