This site uses cookies to improve your experience. To help us insure we adhere to various privacy regulations, please select your country/region of residence. If you do not select a country, we will assume you are from the United States. Select your Cookie Settings or view our Privacy Policy and Terms of Use.
Cookie Settings
Cookies and similar technologies are used on this website for proper function of the website, for tracking performance analytics and for marketing purposes. We and some of our third-party providers may use cookie data for various purposes. Please review the cookie settings below and choose your preference.
Used for the proper function of the website
Used for monitoring website traffic and interactions
Cookie Settings
Cookies and similar technologies are used on this website for proper function of the website, for tracking performance analytics and for marketing purposes. We and some of our third-party providers may use cookie data for various purposes. Please review the cookie settings below and choose your preference.
Strictly Necessary: Used for the proper function of the website
Performance/Analytics: Used for monitoring website traffic and interactions
msn.com) Economy October CPI came in at a 3.1% (ibj.com) Derek Thompson talks with Beverly Tchang about how GLP-1 drugs work. theringer.com) Global American companies can only decouple so much from China. wsj.com) Why isn't there a bridge between Italy and Sicily? year-over-year rate.
Notes: Y-axis doesn't start at zero to better show the seasonal change. -- Gasoline Supplied: Energy Information Administration -- This graph, based on weekly data from the U.S. Energy Information Administration (EIA), shows gasoline supplied compared to the same week of 2019. Blue is for 2020.
Notes: Y-axis doesn't start at zero to better show the seasonal change. -- Gasoline Supplied: Energy Information Administration -- This graph, based on weekly data from the U.S. Energy Information Administration (EIA), shows gasoline supplied compared to the same week of 2019. Blue is for 2020.
Notes: Y-axis doesn't start at zero to better show the seasonal change. -- Gasoline Supplied: Energy Information Administration -- This graph, based on weekly data from the U.S. Energy Information Administration (EIA), shows gasoline supplied compared to the same week of 2019. Blue is for 2020.
Notes: Y-axis doesn't start at zero to better show the seasonal change. -- Gasoline Supplied: Energy Information Administration -- This graph, based on weekly data from the U.S. Energy Information Administration (EIA), shows gasoline supplied compared to the same week of 2019. Blue is for 2020.
Notes: Y-axis doesn't start at zero to better show the seasonal change. -- Gasoline Supplied: Energy Information Administration -- This graph, based on weekly data from the U.S. Energy Information Administration (EIA), shows gasoline supplied compared to the same week of 2019. Blue is for 2020.
Notes: Y-axis doesn't start at zero to better show the seasonal change. -- Gasoline Supplied: Energy Information Administration -- This graph, based on weekly data from the U.S. Energy Information Administration (EIA), shows gasoline supplied compared to the same week of 2019. Blue is for 2020.
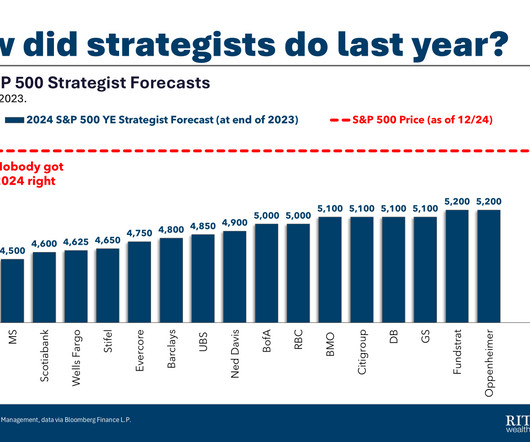
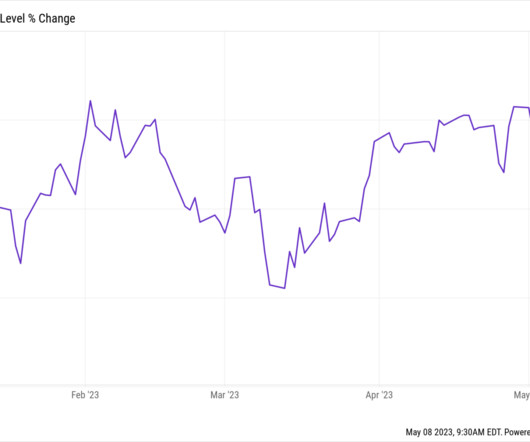
This is how models depict the economy. This is how the economy actually behaves. I think about that calm pond this time of year when the annual Wall Street forecasts for markets and the economy get released. Never confuse opinion marketing with actual, useful information. ~~~ Give thanks this weekend!
Notes: Y-axis doesn't start at zero to better show the seasonal change. -- Gasoline Supplied: Energy Information Administration -- This graph, based on weekly data from the U.S. Energy Information Administration (EIA), shows gasoline supplied compared to the same week of 2019. Blue is for 2020.
Notes: Y-axis doesn't start at zero to better show the seasonal change. -- Gasoline Supplied: Energy Information Administration -- This graph, based on weekly data from the U.S. Energy Information Administration (EIA), shows gasoline supplied compared to the same week of 2019. Blue is for 2020.
Notes: Y-axis doesn't start at zero to better show the seasonal change. -- Gasoline Supplied: Energy Information Administration -- This graph, based on weekly data from the U.S. Energy Information Administration (EIA), shows gasoline supplied compared to the same week of 2019. Blue is for 2020.
Notes: Y-axis doesn't start at zero to better show the seasonal change. -- Gasoline Supplied: Energy Information Administration -- This graph, based on weekly data from the U.S. Energy Information Administration (EIA), shows gasoline supplied compared to the same week of 2019. Blue is for 2020.
and other big firms sent out their calls for 2024, a consensus took shape: After surging more than 20% as artificial intelligence breakthroughs unleashed a tech-stock boom and the economy kept defying the doomsayers, the S&P 500 Index would likely scratch out only a modest gain. So as strategists at Bank of America Corp.,
Notes: Y-axis doesn't start at zero to better show the seasonal change. -- Gasoline Supplied: Energy Information Administration -- This graph, based on weekly data from the U.S. Energy Information Administration (EIA), shows gasoline supplied compared to the same week of 2019. Blue is for 2020.
Notes: Y-axis doesn't start at zero to better show the seasonal change. -- Gasoline Supplied: Energy Information Administration -- This graph, based on weekly data from the U.S. Energy Information Administration (EIA), shows gasoline supplied compared to the same week of 2019. Blue is for 2020.
Notes: Y-axis doesn't start at zero to better show the seasonal change. -- Gasoline Supplied: Energy Information Administration -- This graph, based on weekly data from the U.S. Energy Information Administration (EIA), shows gasoline supplied compared to the same week of 2019. Blue is for 2020.
Notes: Y-axis doesn't start at zero to better show the seasonal change. -- Gasoline Supplied: Energy Information Administration -- This graph, based on weekly data from the U.S. Energy Information Administration (EIA), shows gasoline supplied compared to the same week of 2019. Blue is for 2020.
Notes: Y-axis doesn't start at zero to better show the seasonal change. -- Gasoline Supplied: Energy Information Administration -- This graph, based on weekly data from the U.S. Energy Information Administration (EIA), shows gasoline supplied compared to the same week of 2019. Blue is for 2020.
Notes: Y-axis doesn't start at zero to better show the seasonal change. -- Gasoline Supplied: Energy Information Administration -- This graph, based on weekly data from the U.S. Energy Information Administration (EIA), shows gasoline supplied compared to the same week of 2019. Blue is for 2020.
Notes: Y-axis doesn't start at zero to better show the seasonal change. -- Gasoline Supplied: Energy Information Administration -- This graph, based on weekly data from the U.S. Energy Information Administration (EIA), shows gasoline supplied compared to the same week of 2019. Blue is for 2020.
Notes: Y-axis doesn't start at zero to better show the seasonal change. -- Gasoline Supplied: Energy Information Administration -- This graph, based on weekly data from the U.S. Energy Information Administration (EIA), shows gasoline supplied compared to the same week of 2019. Blue is for 2020.
Notes: Y-axis doesn't start at zero to better show the seasonal change. -- Gasoline Supplied: Energy Information Administration -- This graph, based on weekly data from the U.S. Energy Information Administration (EIA), shows gasoline supplied compared to the same week of 2019. Blue is for 2020.
Notes: Y-axis doesn't start at zero to better show the seasonal change. -- Gasoline Supplied: Energy Information Administration -- This graph, based on weekly data from the U.S. Energy Information Administration (EIA), shows gasoline supplied compared to the same week of 2019. Blue is for 2020.
Notes: Y-axis doesn't start at zero to better show the seasonal change. -- Gasoline Supplied: Energy Information Administration -- This graph, based on weekly data from the U.S. Energy Information Administration (EIA), shows gasoline supplied compared to the same week of 2019. Blue is for 2020.
ft.com) Economy The economy is too hot for its own good. (nytimes.com) Why some AI companies rely on Oracle ($ORCL) for compute. theinformation.com) Finance Office loan delinquencies are on the rise. wsj.com) Smaller banks are more exposed to CRE loans than big banks.
economy continues to be in a good place. Recent Economic Data Economic growth The economy has been growing at a solid pace. It is the net effect of these policy changes that will matter for the economy and for the path of monetary policy. From Fed Chair Powell: Economic Outlook Despite elevated levels of uncertainty, the U.S.
Notes: Y-axis doesn't start at zero to better show the seasonal change. -- Gasoline Supplied: Energy Information Administration -- This graph, based on weekly data from the U.S. Energy Information Administration (EIA), shows gasoline supplied compared to the same week of 2019. Blue is for 2020.
techcrunch.com) Even institutional investors can't get information on their private equity investments. nytimes.com) Economy The 2-year Treasury and Fed fund rates are trading in line with each other. (howardlindzon.com) Finance MicroStrategy ($MSTR) is the convertible bond king. wsj.com) Ramp is expanding its offerings.
The team & I put together the most revealing and informative slides. Sure, RRE/CRE is a huge part of the economy, so its health is always important. But for the purposes of our discussion about the state of the economy and rising interest rates, Real Estate is where the rubber meets the road. This is atypical.
Job Openings: Total Nonfarm : Consider how many jobs remain unfilled today and you have a sense of so many other issues in this economy: Supply chain snarlls, leading to goods shortages, leading to inflation, etc. bottoming in June 1953 at 2.5%. To see wages alone w/o CPI, see this FRED chart). Any suggestions? Share them here.
wsj.com) Economy What is the freight industry tell us about the economy? bonddad.blogspot.com) 2024 Q1 GDP nowcasts are trending around 2% (capitalspectator.com) How increased immigration is boosting the economy. abnormalreturns.com) Research links: information and noise. Then check out our weekly e-mail newsletter.
axios.com) Economy Home prices are still ticking higher. econbrowser.com) How immigration is helping the economy. wapo.st) Earlier on Abnormal Returns Research links: information and noise. (msn.com) Political ads are coming to your favorite streamer. bonddad.blogspot.com) Apartment rents are a mixed bag.
How much will the economy slow in Q3 and Q4? How much will the economy slow in Q3 and Q4? However, when we see the economists’ consensus expectations for Federal Reserve cuts in 2023, that informs us this group is expecting not merely a recession but one deep and long-lasting enough to mandate the FOMC has to respond aggressively.
investmenttalk.substack.com) The economy is always uncertain. biopharmadive.com) Data How data brokers get your personal information. frontofficesports.com) Economy The U.S. economy is facing any number of headwinds. (bloomberg.com) Cash is not a passive investment.
newscientist.com) Economy The July NFP showed a 4.3% fastcompany.com) How investors want to consume information. (engadget.com) GLP-1s Eli Lilly's ($LLY) weight loss drug shortage could end soon. ibj.com) Evidence that GLP-1 drugs can help with a form of heart failure. unemployment rate. Then check out our weekly e-mail newsletter.
That are included in that are not new information. Look, this, this is a t tangled, uh, this is a tangled web, uh, that is critically important to, to the economy. Um, and so I, I think in a higher rate environment, if you’re trying to cool the economy, this is always true. We already knew that. The stock market.
(businessinsider.com) Economy Q2 GDP was revised up to 2.0% carsongroup.com) Anemic wage growth has held back views about the economy. axios.com) Earlier on Abnormal Returns Longform links: the most informed experts. calculatedriskblog.com) Housing has shifted from a headwind to a tailwind.
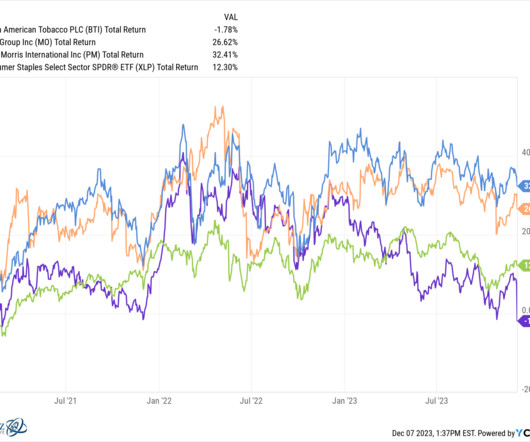
The Information ). • Corporate Stagflation Means Rising Sales With Flat Volumes It’s growth, but not healthy growth, and it doesn’t really help the economy. But people with patience and long horizons came out fine. ( New York Times ). Businessweek ).
The Doc runs a full battery of tests, and delivers the bad news to the patient: “ Unfortunately, everything is okay… ” And that seems to be the same way many of today’s glass half-empty investors are digesting information about the markets. Is it fair to call today’s investors hypochondriacs? Consider : – Unemployment at 3.4%
In fact, it may be even worse than that, because it appears that some at the Federal Reserve actually believe the Fed’s own survey of consumers contains information. At least, it does not contain valuable information providing insight into future inflation levels. As we have previously shown (repeatedly), it does not.
axios.com) Economy Kyla Scanlon, "People are complex and economics doesn’t (can’t!) stratechery.com) The Information stands out as a digital media success, ten years in. (yahoo.com) Why SpaceX continues to win new launch business. bloomberg.com) Bonds Vanguard is launching new actively managed bond ETFs. take that into consideration."
morningstar.com) Books Barry Ritholtzs "How Not to Invest" is a 'very informative book about investing that is most importantly a lot of fun.' bloomberg.com) Economy Weekly initial claims remain quiescent. (axios.com) The U.S. stock market is a standout in 2025, and not in a good way. niemanlab.org) NYT Cooking is a standout success.
We organize all of the trending information in your field so you don't have to. Join 36,000+ users and stay up to date on the latest articles your peers are reading.
You know about us, now we want to get to know you!
Let's personalize your content
Let's get even more personalized
We recognize your account from another site in our network, please click 'Send Email' below to continue with verifying your account and setting a password.


Let's personalize your content