This site uses cookies to improve your experience. To help us insure we adhere to various privacy regulations, please select your country/region of residence. If you do not select a country, we will assume you are from the United States. Select your Cookie Settings or view our Privacy Policy and Terms of Use.
Cookie Settings
Cookies and similar technologies are used on this website for proper function of the website, for tracking performance analytics and for marketing purposes. We and some of our third-party providers may use cookie data for various purposes. Please review the cookie settings below and choose your preference.
Used for the proper function of the website
Used for monitoring website traffic and interactions
Cookie Settings
Cookies and similar technologies are used on this website for proper function of the website, for tracking performance analytics and for marketing purposes. We and some of our third-party providers may use cookie data for various purposes. Please review the cookie settings below and choose your preference.
Strictly Necessary: Used for the proper function of the website
Performance/Analytics: Used for monitoring website traffic and interactions
Notes: I've added back gasoline supplied to see if there is an impact from higher gasoline prices. -- Airlines: Transportation Security Administration -- The TSA is providing daily travel numbers. This data is as of September 11th. Click on graph for larger image. Black is 2020, Blue is 2021 and Red is 2022.
Notes: I've added back gasoline supplied to see if there is an impact from higher gasoline prices. -- Airlines: Transportation Security Administration -- The TSA is providing daily travel numbers. This data is as of August 7th. Click on graph for larger image. Black is 2020, Blue is 2021 and Red is 2022.
Apple has discontinued "Apple mobility", and restaurant traffic is mostly back to normal. -- Airlines: Transportation Security Administration -- The TSA is providing daily travel numbers. This data is as of July 31st. Click on graph for larger image. Black is 2020, Blue is 2021 and Red is 2022.
It was interesting to watch these sectors recover as the pandemic impact subsided. -- Airlines: Transportation Security Administration -- The TSA is providing daily travel numbers. This data is as of November 6th. Click on graph for larger image. Black is 2020, Blue is 2021 and Red is 2022. The data is from BoxOfficeMojo through November 3rd.
Notes: I've added back gasoline supplied to see if there is an impact from higher gasoline prices. -- Airlines: Transportation Security Administration -- The TSA is providing daily travel numbers. This data is as of September 4th. Click on graph for larger image. Black is 2020, Blue is 2021 and Red is 2022.
Notes: I've added back gasoline supplied to see if there is an impact from higher gasoline prices. -- Airlines: Transportation Security Administration -- The TSA is providing daily travel numbers. This data is as of September 25th. Click on graph for larger image. Black is 2020, Blue is 2021 and Red is 2022.
The PMI numbers are diffusion indexes. With the exception of the early stages of the pandemic, the decrease in total new sales was the sharpest since 2009. November even saw increasing numbers of suppliers, factories and service providers offering discounts to help boost flagging sales. October: 47.8). 3-month low.
Notes: I've added back gasoline supplied to see if there is an impact from higher gasoline prices. -- Airlines: Transportation Security Administration -- The TSA is providing daily travel numbers. This data is as of August 21st. Click on graph for larger image. Black is 2020, Blue is 2021 and Red is 2022.
Consumer spending moved up moderately, with most Districts reporting strong holiday sales that exceeded expectations. Vehicle sales grew modestly. Manufacturing decreased slightly on net, and a number of Districts said manufacturers were stockpiling inventories in anticipation of higher tariffs.
It is interesting to watch these sectors recover as the pandemic subsides. -- Airlines: Transportation Security Administration -- The TSA is providing daily travel numbers. These indicators are mostly for travel and entertainment. This data is as of October 23rd. Click on graph for larger image. Black is 2020, Blue is 2021 and Red is 2022.
It is interesting to watch these sectors recover as the pandemic subsides. -- Airlines: Transportation Security Administration -- The TSA is providing daily travel numbers. These indicators are mostly for travel and entertainment. This data is as of October 30th. Click on graph for larger image. Black is 2020, Blue is 2021 and Red is 2022.
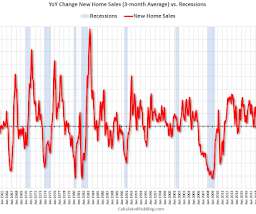
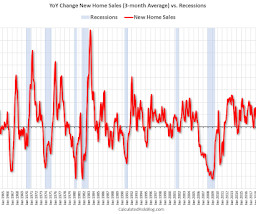
We did see negative real GDP growth in Q1 and in Q2 - but that didn't mean the US economy was in a recession (and this has never been the definition of a US recession). And other measures of the economy were also positive, especially employment. I also look at the yield curve, but I've found new home sales is generally more useful.
Back in early 2009, I wrote a couple of posts arguing there would be an increase in auto sales - Vehicle Sales (Jan 2009) and Looking for the Sun (Feb 2009). This was an out-of-the-consensus call and helped me call the bottom for the US economy in mid-2009. This graph shows the total number of registered vehicles in the U.S.
Notes: I've added back gasoline supplied to see if there is an impact from higher gasoline prices. -- Airlines: Transportation Security Administration -- The TSA is providing daily travel numbers. This data is as of August 28th. Click on graph for larger image. Black is 2020, Blue is 2021 and Red is 2022.
Some of these questions concern real estate (inventory, house prices, housing starts, new home sales), and I’ll post thoughts on those in the newsletter (others like GDP and employment will be on this blog). 2) Employment: The economy added 4.5 Or will the economy lose jobs? Or will the economy lose jobs?
Two examples: not reaching a fiscal agreement and going off the "fiscal cliff" probably would have led to a recession, and Congress refusing to "pay the bills" would have been a policy error that would have taken the economy into recession. I also look at the yield curve, but I've found new home sales is generally more useful.
It was interesting to watch these sectors recover as the pandemic impact subsided. -- Airlines: Transportation Security Administration -- The TSA is providing daily travel numbers. This data is as of November 13th. Click on graph for larger image. Black is 2020, Blue is 2021 and Red is 2022.
It is interesting to watch these sectors recover as the pandemic subsides. -- Airlines: Transportation Security Administration -- The TSA is providing daily travel numbers. These indicators are mostly for travel and entertainment. This data is as of October 15th. Click on graph for larger image. Black is 2020, Blue is 2021 and Red is 2022.
It has been interesting watching these sectors recover as the pandemic impact subsided. -- Airlines: Transportation Security Administration -- The TSA is providing daily travel numbers. This data is as of December 25th. Click on graph for larger image. Black is 2020, Blue is 2021 and Red is 2022.
It was interesting to watch these sectors recover as the pandemic impact subsided. -- Airlines: Transportation Security Administration -- The TSA is providing daily travel numbers. This data is as of December 4th. Click on graph for larger image. Black is 2020, Blue is 2021 and Red is 2022. The data is from BoxOfficeMojo through December 1st.
It is interesting to watch these sectors recover as the pandemic subsides. -- Airlines: Transportation Security Administration -- The TSA is providing daily travel numbers. These indicators are mostly for travel and entertainment. This data is as of October 8th. Click on graph for larger image. Black is 2020, Blue is 2021 and Red is 2022.
Notes: I've added back gasoline supplied to see if there is an impact from higher gasoline prices. -- Airlines: Transportation Security Administration -- The TSA is providing daily travel numbers. This data is as of August 14th. Click on graph for larger image. Black is 2020, Blue is 2021 and Red is 2022.
Apple has discontinued "Apple mobility", and restaurant traffic is mostly back to normal. -- Airlines: Transportation Security Administration -- The TSA is providing daily travel numbers. This data is as of July 24th. Click on graph for larger image. Black is 2020, Blue is 2021 and Red is 2022.
It was interesting to watch these sectors recover as the pandemic impact subsided. -- Airlines: Transportation Security Administration -- The TSA is providing daily travel numbers. This data is as of November 27th. Click on graph for larger image. Black is 2020, Blue is 2021 and Red is 2022.
It was interesting to watch these sectors recover as the pandemic impact subsided. -- Airlines: Transportation Security Administration -- The TSA is providing daily travel numbers. This data is as of December 18th. Click on graph for larger image. Black is 2020, Blue is 2021 and Red is 2022.
Two examples: not reaching a fiscal agreement and going off the "fiscal cliff" probably would have led to a recession, and Congress refusing to "pay the bills" would have been a policy error that would have taken the economy into recession. Note that Residential Investment is quarterly and single-family starts and new home sales are monthly.
(ft.com) EVs EVs made up 8% of sales in Q2. fastcompany.com) Economy It's hard not to argue the economy is weakening. disciplinefunds.com) Jobs numbers get revised all the time. coxautoinc.com) Ford ($F) is backtracking on big EV SUVs and doubling down on hybrids.
It was interesting to watch these sectors recover as the pandemic impact subsided. -- Airlines: Transportation Security Administration -- The TSA is providing daily travel numbers. This data is as of December 11th. Click on graph for larger image. Black is 2020, Blue is 2021 and Red is 2022.
It was interesting to watch these sectors recover as the pandemic impact subsided. -- Airlines: Transportation Security Administration -- The TSA is providing daily travel numbers. This data is as of November 20th. Click on graph for larger image. Black is 2020, Blue is 2021 and Red is 2022.
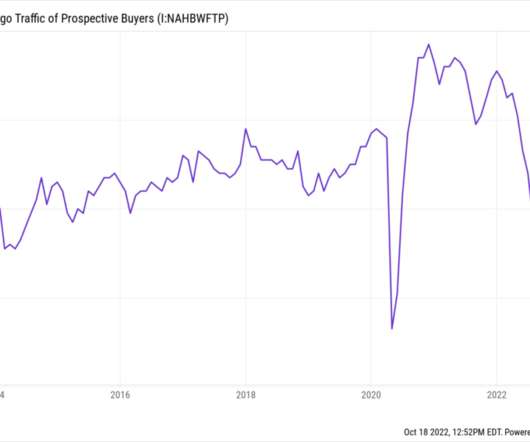
Sure, RRE/CRE is a huge part of the economy, so its health is always important. But for the purposes of our discussion about the state of the economy and rising interest rates, Real Estate is where the rubber meets the road. The post Collapse in Prospective Home Buyer Traffic appeared first on The Big Picture.
It is interesting to watch these sectors recover as the pandemic subsides. -- Airlines: Transportation Security Administration -- The TSA is providing daily travel numbers. These indicators are mostly for travel and entertainment. This data is as of October 2nd. Click on graph for larger image. Black is 2020, Blue is 2021 and Red is 2022.
morningstar.com) Economy Mortgage refinancing applications are on the rise. sherwood.news) The number of existing homes for sales keeps rising. (morningstar.com) The Texas Capital Government Money Market ETF ($MMKT) has launched. (fa-mag.com) fa-mag.com) A lot of active ETFs have launched, not many will survive.
Existing home sales from the National Association of Realtors via St. Frozen Market The National Association of Realtors (NAR) reports Existing-Home Sales Slumped 7.7% Frozen Market The National Association of Realtors (NAR) reports Existing-Home Sales Slumped 7.7% Sales slipped 7.7% Existing Home Sales Supply.
(theverge.com) Ozempic accounted for 41% of Novo Nordisk’s ($NVO) total sales in 2023. wapo.st) Why is Apple ($AAPL) publicly touting its Apple Card spending numbers? blog.johnwallstreet.com) Economy The labor market continues to soften. spyglass.org) Sports The PGA Tour just scored a big, non-Saudi, investment.
washingtonpost.com) Economy American consumer behavior is normalizing. tker.co) The mix of light vehicle sales keeps shifting toward pickups and SUVs. newsletter.abnormalreturns.com) Mixed media A growing number of New York City office buildings are emptying out. noahpinion.blog) The NBA is a model for immigration policy.
How much will the economy slow in Q3 and Q4? How much will the economy slow in Q3 and Q4? We have already seen a massive slowdown in home sales. The economy, corporate revenues, earnings, and consumer spending are to some degree path dependent. Here are five of those questions: 1. The trillion-dollar question.
The supply side was healing on the supply chain, and there was a big surge of labor force participation from a number of groups. So you got a number of positive supply shocks that are exactly what allowed for the immaculate disinflation, which the people who thought that was impossible use that phrase mockingly. I think number one.
By any measure, we still have an enormous number of unfilled positions. This attests to the robustness of the labor economy, recession or not. Rather than accept their fate, Americans used free money offered by the private unregulated banking system in the form of Home Sales, HELOCs, and Refinancings.
institutionalinvestor.com) Amazon Amazon ($AMZN) is increasing the number of same-day shipping options. wsj.com) Sketchy products keep showing up for sale on Amazon ($AMZN). theatlantic.com) Economy Menzie Chinn, "Strong labor market, spending and income numbers all suggest no recession in place yet."
As an example, when the pandemic hit, I switched from being mostly positive on the economy to calling a recession in early March 2020. This appears to include some pending sales and doesn’t match some other measures of inventory (Altos and Realtor.com). How about housing starts and new home sales in 2022? "My
Here is their weekly report from economist Danielle Hale: Weekly Housing Trends View — Data Week Ending July 1, 2023 • Active inventory declined, with for-sale homes lagging behind year ago levels by 2%. New listings–a measure of sellers putting homes up for sale–were down again this week, by 21% from one year ago.
Further, critics of non-compete agreements argue that they restrict dynamism in the overall economy by making it harder for businesses to hire (as the pool of applicants will be smaller in industries where non-competes are prevalent ), and for employees subject to non-competes to start new companies.
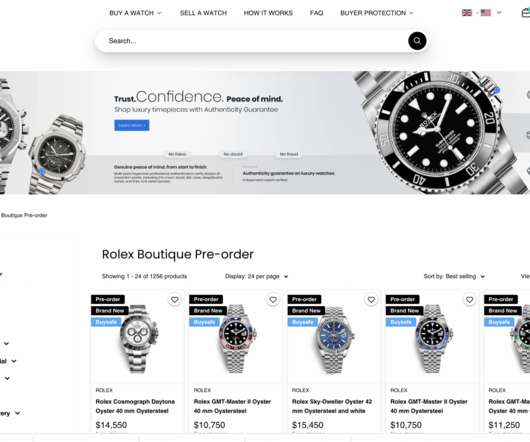
Watch Rapport (link omitted on purpose) has every Rollie for sale up for pre-order at MSRP. I find it hard to believe something that obvious is the play, so I call the number listed at their Facebook account: (800) 571-7765. Sounds pretty good right? Maybe, a little too good? . Of note: Delivery within 180 Days.
Early Benchmark Methodology Preliminary (not-yet-benchmarked) state employment estimates from the Bureau of Labor Statistics (BLS) continue to be subject to significant revisions around turning points in the economy. Economy Added 263,000 Jobs in November" Both reports and mainstream in general miss the big picture captured in my lead chart.
We organize all of the trending information in your field so you don't have to. Join 36,000+ users and stay up to date on the latest articles your peers are reading.
You know about us, now we want to get to know you!
Let's personalize your content
Let's get even more personalized
We recognize your account from another site in our network, please click 'Send Email' below to continue with verifying your account and setting a password.


Let's personalize your content