This site uses cookies to improve your experience. To help us insure we adhere to various privacy regulations, please select your country/region of residence. If you do not select a country, we will assume you are from the United States. Select your Cookie Settings or view our Privacy Policy and Terms of Use.
Cookie Settings
Cookies and similar technologies are used on this website for proper function of the website, for tracking performance analytics and for marketing purposes. We and some of our third-party providers may use cookie data for various purposes. Please review the cookie settings below and choose your preference.
Used for the proper function of the website
Used for monitoring website traffic and interactions
Cookie Settings
Cookies and similar technologies are used on this website for proper function of the website, for tracking performance analytics and for marketing purposes. We and some of our third-party providers may use cookie data for various purposes. Please review the cookie settings below and choose your preference.
Strictly Necessary: Used for the proper function of the website
Performance/Analytics: Used for monitoring website traffic and interactions
economy will likely perform in 2025, and if there are surprises - like in 2020 with the pandemic - to adjust my thinking. There is also the potential for significant policy mistakes, but for now I'm assuming any policy changes will not significantly impact the economy in 2025. How much will the economy grow in 2025? Q4-over-Q4).
economy is performing. economy, its performance has been very good." From BofA: Next week, we will initiate our 4Q GDP tracker with the October retail sales print and Oct industrial production and Sep business inventories. Fed Chair Powell, Nov 7, 2024: "It's actually remarkable how strong the U.S. percent on November 5.
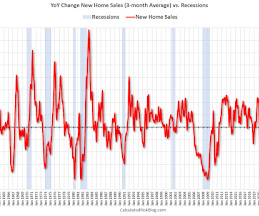
Here is an update to a graph that uses new home sales, single family housing starts and residential investment. (I Note that Residential Investment is quarterly and single-family starts and new home sales are monthly. New home sales peaked in 2020 as pandemic buying soared. Another indicator I like to use is heavy truck sales.
From the NAR: Pending Home Sales Advanced 7.4% in September ending home sales rose in September, according to the National Association of REALTORS®. Year-over-year, the Northeast and West registered increases while sales remained steady in the Midwest and South. in September, the highest level since March (78.3).
From the NAR: Pending Home Sales Dropped 2.1% in May Pending home sales in May slipped 2.1% , according to the National Association of REALTORS®. The Pending Home Sales Index (PHSI)* – a forward-looking indicator of home sales based on contract signings – decreased to 70.8 Year-over-year, all U.S. a decline of 2.3%
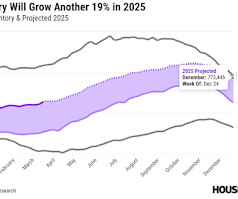
If inventory is close to 2019 levels by the end of 2025, and sales remain sluggish, months-of-supply will move up sharply. Sales could pick up if mortgage rates decline, however, if the decline is related to a weaker economy, the increase in unemployment might outweigh any boost from lower mortgage rates.
Movie ticket sales were at $82 million last week, down about 44% from the median for the week. -- Hotel Occupancy: STR -- This graph shows the seasonal pattern for the hotel occupancy rate using the four-week average. Black is 2020, Blue is 2021 and Red is 2022. The data is from BoxOfficeMojo through September 8th.
Movie ticket sales were at $194 million last week, down about 29% from the median for the week. -- Hotel Occupancy: STR -- This graph shows the seasonal pattern for the hotel occupancy rate using the four-week average. Black is 2020, Blue is 2021 and Red is 2022. The data is from BoxOfficeMojo through July 28th.
Movie ticket sales were at $151 million last week, down about 40% from the median for the week. -- Hotel Occupancy: STR -- This graph shows the seasonal pattern for the hotel occupancy rate using the four-week average. Black is 2020, Blue is 2021 and Red is 2022. The data is from BoxOfficeMojo through August 4th.
Movie ticket sales were at $78 million last week, down about 53% from the median for the week. -- Hotel Occupancy: STR -- This graph shows the seasonal pattern for the hotel occupancy rate using the four-week average. Black is 2020, Blue is 2021 and Red is 2022. The data is from BoxOfficeMojo through September 1st.
Movie ticket sales were at $91 million last week, down about 39% from the median for the week. -- Hotel Occupancy: STR -- This graph shows the seasonal pattern for the hotel occupancy rate using the four-week average. Black is 2020, Blue is 2021 and Red is 2022. The data is from BoxOfficeMojo through November 3rd.
Movie ticket sales were at $71 million last week, down about 52% from the median for the week. -- Hotel Occupancy: STR -- This graph shows the seasonal pattern for the hotel occupancy rate using the four-week average. Black is 2020, Blue is 2021 and Red is 2022. The data is from BoxOfficeMojo through September 22nd.
Sales of farm equipment were a notable headwind to overall investment activity, and several contacts expressed concerns about the future prices of equipment given ongoing weakness in the farm economy. Capital spending and purchases of raw materials were flat or declining in most Districts.
Some of these questions concern real estate (inventory, house prices, housing starts, new home sales), and I’ll post thoughts on those in the newsletter (others like GDP and employment will be on this blog). 1) Economic growth: Economic growth was probably close to 1% in 2022 as the economy slowed following the economic rebound in 2021.
With the exception of the early stages of the pandemic, the decrease in total new sales was the sharpest since 2009. November even saw increasing numbers of suppliers, factories and service providers offering discounts to help boost flagging sales.
Some of these questions concern real estate (inventory, house prices, housing starts, new home sales), and I’ll post thoughts on those in the newsletter (others like GDP and employment will be on this blog). 2) Employment: Through November 2023, the economy added 2.6 Or will the economy lose jobs? Or will the economy lose jobs?
Light-Vehicle Sales, Inventory Pegged for Solid Gains; First-Quarter Deliveries to Rise 7% (pay content). Brief excerpt: Though gradually improving, inventory remains the story behind why sales remain low by historical standards. This graph shows actual sales from the BEA (Blue), and Wards forecast for March (Red).
The BEA released their estimate of light vehicle sales for December. The BEA estimates sales of 13.31 from the November sales rate, and up 4.7% The first graph shows annual sales since 1976. Light vehicle sales in 2022 were at 13.73 Light vehicle sales in 2022 were at 13.73 Sales were decent in December.
propublica.org) Economy Retail sales are decelerating. calculatedriskblog.com) More signs the economy is weakening. (paulkrugman.substack.com) The U.S. has halted efforts to clean up Agent Orange in Vietnam. bonddad.blogspot.com) National home builder confidence fell in March.
From the NAR: Pending Home Sales Dropped 2.0% in August Pending home sales sagged for the third straight month in August, according to the National Association of REALTORS®. The Pending Home Sales Index (PHSI), a forward-looking indicator of home sales based on contract signings, fell 2.0% The Northeast PHSI decreased 3.4%
Movie ticket sales were at $99 million last week, down about 54% from the median for the week. -- Hotel Occupancy: STR -- This graph shows the seasonal pattern for the hotel occupancy rate using the four-week average. Black is 2020, Blue is 2021 and Red is 2022. The data is from BoxOfficeMojo through August 18th.
Light-Vehicle Sales to Slow from Prior Month; Still Point to Stronger Q4 (pay content). This graph shows actual sales from the BEA (Blue), and Wards forecast for November (Red). million SAAR, would be down 3% from last month, but up 11% from a year ago (sales weakened in the second half of 2021, due to supply chain issues).
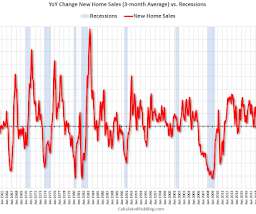
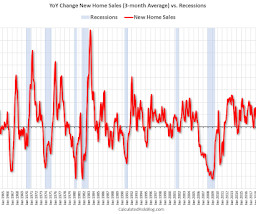
We did see negative real GDP growth in Q1 and in Q2 - but that didn't mean the US economy was in a recession (and this has never been the definition of a US recession). And other measures of the economy were also positive, especially employment. I also look at the yield curve, but I've found new home sales is generally more useful.
msn.com) How big a disappointment are Apple ($AAPL) VIsion Pro sales? statnews.com) Economy Where does economic growth come from? (humbledollar.com) Companies How did Boeing ($BA) go so wrong? wsj.com) Taiwan Semiconductor's ($TSM) Arizona plant is outperforming those in Taiwan. awealthofcommonsense.com) R&D spending in the U.S.
Movie ticket sales were at $96 million last week, down about 42% from the median for the week. -- Hotel Occupancy: STR -- This graph shows the seasonal pattern for the hotel occupancy rate using the four-week average. Black is 2020, Blue is 2021 and Red is 2022. The data is from BoxOfficeMojo through October 20th.
Movie ticket sales were at $147 million last week, down about 7% from the median for the week. -- Hotel Occupancy: STR -- This graph shows the seasonal pattern for the hotel occupancy rate using the four-week average. Black is 2020, Blue is 2021 and Red is 2022. The data is from BoxOfficeMojo through October 27th.
Some of these questions concern real estate (inventory, house prices, housing starts, new home sales), and I’ll post thoughts on those in the newsletter (others like GDP and employment will be on this blog). 2) Employment: The economy added 4.5 Or will the economy lose jobs? Or will the economy lose jobs?
Movie ticket sales were at $109 million last week, down about 41% from the median for the week. -- Hotel Occupancy: STR -- This graph shows the seasonal pattern for the hotel occupancy rate using the four-week average. Black is 2020, Blue is 2021 and Red is 2022. The data is from BoxOfficeMojo through August 25th.
Two examples: not reaching a fiscal agreement and going off the "fiscal cliff" probably would have led to a recession, and Congress refusing to "pay the bills" would have been a policy error that would have taken the economy into recession. I also look at the yield curve, but I've found new home sales is generally more useful.
Back in early 2009, I wrote a couple of posts arguing there would be an increase in auto sales - Vehicle Sales (Jan 2009) and Looking for the Sun (Feb 2009). This was an out-of-the-consensus call and helped me call the bottom for the US economy in mid-2009. And in April 2020, sales collapsed due to the onset of the pandemic.
Movie ticket sales were at $75 million last week, down about 58% from the median for the week. -- Hotel Occupancy: STR -- This graph shows the seasonal pattern for the hotel occupancy rate using the four-week average. Black is 2020, Blue is 2021 and Red is 2022. The data is from BoxOfficeMojo through November 10th.
economy will perform in 2023, and if there are surprises - like in 2020 - to adjust my thinking. 1) Economic growth: Economic growth was probably under 1% in 2022 as the economy slowed following the economic rebound in 2021. How much will the economy grow in 2023? 2) Employment: Through November 2022, the economy added 4.3
Movie ticket sales were at $83 million last week, down about 55% from the median for the week. -- Hotel Occupancy: STR -- This graph shows the seasonal pattern for the hotel occupancy rate using the four-week average. Black is 2020, Blue is 2021 and Red is 2022. The data is from BoxOfficeMojo through October 13th.
Movie ticket sales were at $236 million last week, up about 37% from the median for the week - thanks to "Avatar: The Way of Water". -- Hotel Occupancy: STR -- This graph shows the seasonal pattern for the hotel occupancy rate using the four-week average. Black is 2020, Blue is 2021 and Red is 2022.
Movie ticket sales were at $115 million last week, down about 57% from the median for the week. -- Hotel Occupancy: STR -- This graph shows the seasonal pattern for the hotel occupancy rate using the four-week average. Black is 2020, Blue is 2021 and Red is 2022. The data is from BoxOfficeMojo through December 1st.
Movie ticket sales were at $88 million last week, down about 35% from the median for the week. -- Hotel Occupancy: STR -- This graph shows the seasonal pattern for the hotel occupancy rate using the four-week average. Black is 2020, Blue is 2021 and Red is 2022. The data is from BoxOfficeMojo through October 6th.
Movie ticket sales were at $136 million last week, down about 39% from the median for the week. -- Hotel Occupancy: STR -- This graph shows the seasonal pattern for the hotel occupancy rate using the four-week average. Black is 2020, Blue is 2021 and Red is 2022. The data is from BoxOfficeMojo through August 11th.
Movie ticket sales were at $206 million last week, down about 18% from the median for the week. -- Hotel Occupancy: STR -- This graph shows the seasonal pattern for the hotel occupancy rate using the four-week average. Black is 2020, Blue is 2021 and Red is 2022. The data is from BoxOfficeMojo through July 21st.
Two examples: not reaching a fiscal agreement and going off the "fiscal cliff" probably would have led to a recession, and Congress refusing to "pay the bills" would have been a policy error that would have taken the economy into recession. Note that Residential Investment is quarterly and single-family starts and new home sales are monthly.
Consumer spending moved up moderately, with most Districts reporting strong holiday sales that exceeded expectations. Vehicle sales grew modestly. Commercial real estate sales edged up. Fed's Beige Book Economic activity increased slightly to moderately across the twelve Federal Reserve Districts in late November and December.
Some of those questions concerned real estate (inventory, house prices, housing starts, new home sales), and I posted thoughts on those in the newsletter (others like GDP and employment are on this blog). How much will the economy grow in 2024? How much will the economy grow in 2024? The FOMC is expecting growth of 1.2%
Movie ticket sales were at $142 million last week, down about 45% from the median for the week. -- Hotel Occupancy: STR -- NOTE: This is the previous week data, since hotel data wasn't released during the holiday week. Black is 2020, Blue is 2021 and Red is 2022. The data is from BoxOfficeMojo through November 24th.
Movie ticket sales were at $50 million last week, down about 59% from the median for the week. -- Hotel Occupancy: STR -- This graph shows the seasonal pattern for the hotel occupancy rate using the four-week average. Black is 2020, Blue is 2021 and Red is 2022. The data is from BoxOfficeMojo through December 15th.
The bottom line remains the same: There will not be cascading price declines in this cycle due to distressed sales. It wouldn't take a RE bust to impact the general economy. Just a slowdown in both volume (to impact employment) and in prices (to slow down borrowing) might push the general economy into recession.
We organize all of the trending information in your field so you don't have to. Join 36,000+ users and stay up to date on the latest articles your peers are reading.
You know about us, now we want to get to know you!
Let's personalize your content
Let's get even more personalized
We recognize your account from another site in our network, please click 'Send Email' below to continue with verifying your account and setting a password.


Let's personalize your content