This site uses cookies to improve your experience. To help us insure we adhere to various privacy regulations, please select your country/region of residence. If you do not select a country, we will assume you are from the United States. Select your Cookie Settings or view our Privacy Policy and Terms of Use.
Cookie Settings
Cookies and similar technologies are used on this website for proper function of the website, for tracking performance analytics and for marketing purposes. We and some of our third-party providers may use cookie data for various purposes. Please review the cookie settings below and choose your preference.
Used for the proper function of the website
Used for monitoring website traffic and interactions
Cookie Settings
Cookies and similar technologies are used on this website for proper function of the website, for tracking performance analytics and for marketing purposes. We and some of our third-party providers may use cookie data for various purposes. Please review the cookie settings below and choose your preference.
Strictly Necessary: Used for the proper function of the website
Performance/Analytics: Used for monitoring website traffic and interactions
The Great Crash 1929 by John Kenneth Galbraith was poetically published in 1954, the first year that stocks would eclipse their 1929 highs. One of the most enjoyable aspects of reading about events that shaped history is getting a better sense of what actually happened. Ninety years later, the stories tend to morph into something a few steps farther than reality.
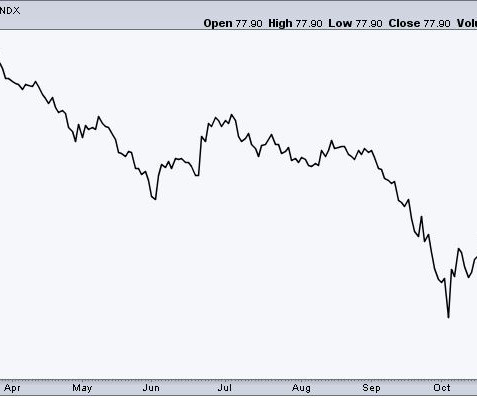
Investment Perspectives | China's Shock. achen. Thu, 10/01/2015 - 09:32. After years of steady, even quiet, market appreciation, investors were jolted awake by the late August swoon in stocks around the world. Those returning from vacations where they had no contact with the outside world (admittedly, hard to do these days) probably wondered, “What in the world is going on here?”.
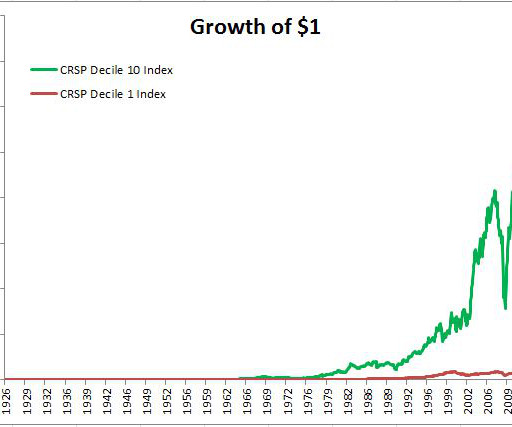
This is the small cap secret no one ever told you; You've probably heard about the small stock premium, the idea that over long periods of time, small stocks outperform large stocks. There are a bunch of different theories as to why this is the case. Some believe the additional returns are compensation for decreased liquidity, additional volatility, or both.
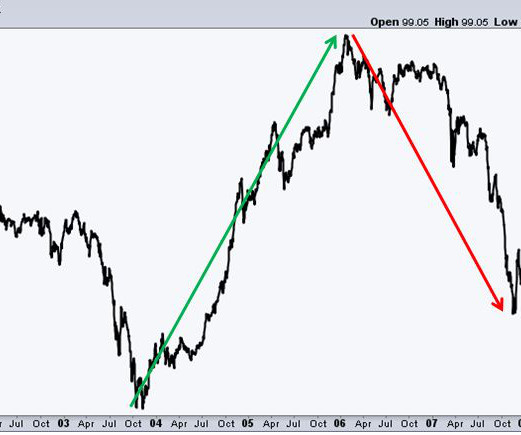
From 1929 through 1932, the Dow Jones Industrial Average would lose nearly ninety percent of its value. In this four year period, there were several nasty bear market rallies, lifting the hopes of the hopeful, only to be met with tidal waves of selling. Corporations were collapsing and individuals didn't fare much better. Unemployment in the United States was 25% and U.S.
As businesses increasingly adopt automation, finance leaders must navigate the delicate balance between technology and human expertise. This webinar explores the critical role of human oversight in accounts payable (AP) automation and how a people-centric approach can drive better financial performance. Join us for an insightful discussion on how integrating human expertise into automated workflows enhances decision-making, reduces fraud risks, strengthens vendor relationships, and accelerates R
Are the owners of great track records incredibly skilled, or incredibly lucky? This is one of the oldest questions in finance. To explore this further, I'm going to borrow from Scott Patterson and Jack Schwager, the authors of two fantastic books, The Quants and Market Wizards. Here is Gene Fama, Nobel Laureate, the father of modern finance and longtime professor at the University of Chicago, talking to a classroom of students (The Quants, pages 77-79).
Brattle St Capital is one of my favorite follows on Twitter. He's constantly sharing interesting data, quotes and other valuable investing insights. The fact that he's doing so anonymously, in which he receives no personal recognition, makes it that much more awesome. Yesterday, he offered some lousy investment theses, learned through experience, which I wanted to share.
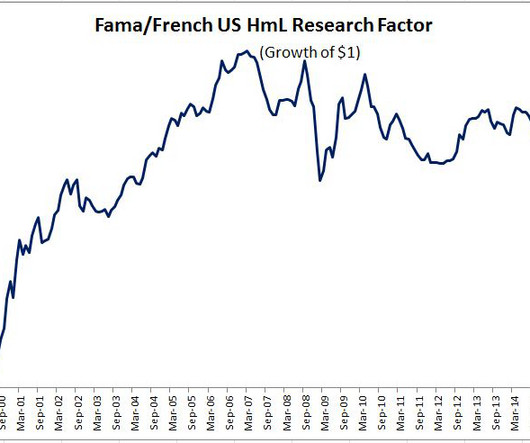
Fama and French wrote "The Cross-Section of Expected Stock Returns" in 1992, unveiling their three-factor model. They expanded on CAPM, which boils down stock returns to just one factor, beta. Fama and French took this a step further, finding that the vast majority of a stocks returns can be explained not just by beta, but by size and book-t0-market as well.
Fama and French wrote "The Cross-Section of Expected Stock Returns" in 1992, unveiling their three-factor model. They expanded on CAPM, which boils down stock returns to just one factor, beta. Fama and French took this a step further, finding that the vast majority of a stocks returns can be explained not just by beta, but by size and book-t0-market as well.
At sub two percent on the ten-year treasury, many investors are questioning why bother owning bonds at all. As ninety percent of the returns are derived from the starting interest rate, it's fair to assume that bonds will indeed offer measly returns going forward. While it's not realistic to expect the returns of the last thirty years to continue, I still see great merit to holding bonds in a diversified portfolio.
The last few days and weeks are a great reminder of how difficult it is to successfully trade stocks. There's a reason why there aren't many traders that are household names. Even people in the business would likely find it difficult to rattle off ten legendary traders. One of those legends, Paul Tudor Jones had this to say about trading: "My metric for everything I look at is the 200-day moving average of closing prices.
When the average person tries their hand at stock picking, they'll go on the internet and check the price-to-earnings ratio. Maybe they'll dig a little deeper and look at the some other statistics. They'll check the institutional ownership, look at the competition, look at its historical valuation, growth rates, debt levels, etc. If you've played this game before, you know how this usually turns out.
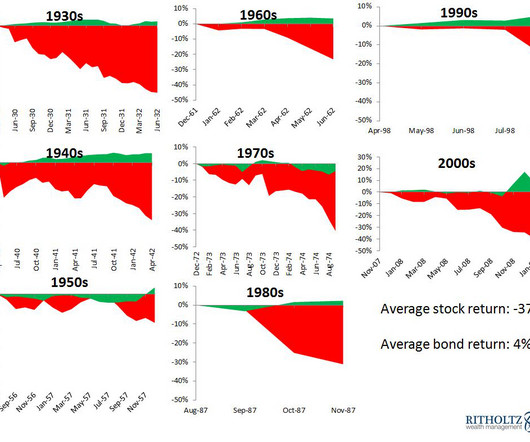
Good defense is more important than good offense not just on the football field, but on the investing field as well. Stocks experienced double-digit drawdowns in each of the last eleven decades, with the pain averaging -38%. Let's take a look at some of the gains and losses to get a better feel of how debilitating these declines can be. From November 1903 through January 1906, the Dow Jones Industrial Average gained 127%.
Based off SkyStem's popular e-Book, the book of secrets to the month-end close will be revealed in this one-hour webinar. Learn leading practices when it comes to building a strong and sustainable month-end close that has room to grow and evolve. Learn about the power of precise estimates, why reconciliations are critical to closing the books, how and when to automate, and how the chart of accounts play into your close process.
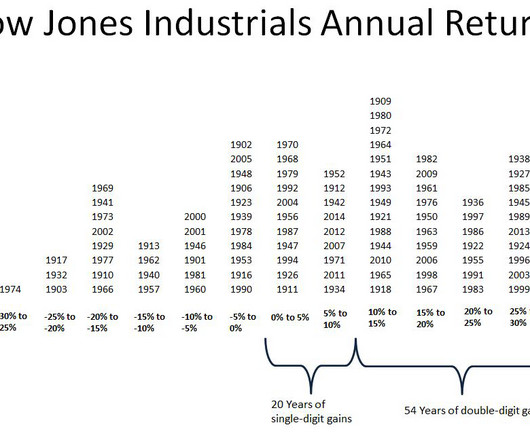
After a strong year for stocks, does it make sense for investors to dampen their expectations? That’s what many investors, professional or otherwise, were saying heading into 2014, following a year when stocks made new all-time highs and gained ~30 percent. Looking at the data shows that stocks have actually performed better than average following an exceptionally strong year.
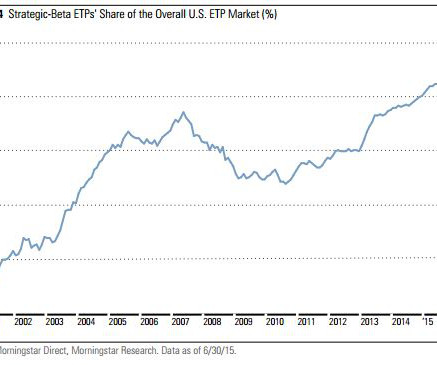
Investors have become enamored with alternative ways to slice and dice the indices. According to Morningstar , “Strategic Beta” now accounts for 21% of total industry (ETP) assets, up from under 5% in 2000. As assets have exploded, so too has the number of strategic-beta ETPs, which have grown from 673 to 844 in the past year, while assets grew 25% to $497 billion.
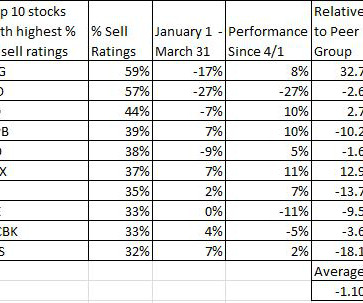
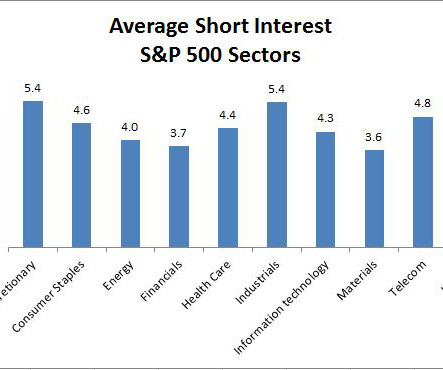
Stocks are continuing to rally from deeply oversold conditions. While the rebound is welcome, it's worth taking look under the hood to see whats driving the recent performance. Here are the YTD returns for the six strongest stocks in the S&P 500 today: FCX: -45% JOY: -63% CNX: -66% WYNN: -52% SNI: -28% GNW: -36% What is interesting about this list is that although these stocks have been pummeled in 2015, there are not too many shorts reaping the benefits.
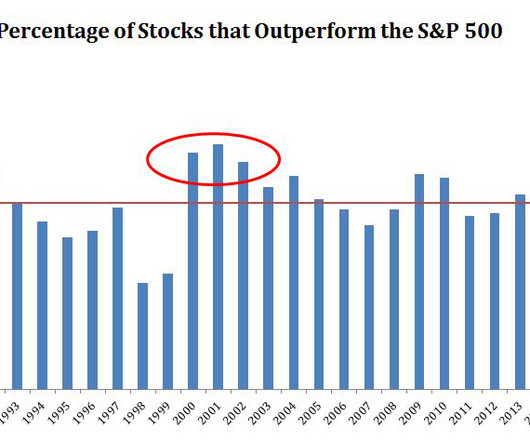
Over the last five and ten years, less than twenty percent of large-cap managers beat their benchmark. Should we be surprised to see that eighty percent of these funds fail to deliver returns above the S&P 500? Let's turn to the data. On average, 50.6% of stocks beat the market in any given year. This makes intuitive sense, half the stocks beat the index and half do worse.
Like being inches from the end zone, many advisors are frustratingly close to their next level of success. You work hard. You put in the hours. But if your closing rate is stuck or your pipeline feels like a revolving door… something has to change. Most advisors are just one small shift away from dramatically increasing their revenue. The difference?
If Donald Trump were to weigh in on value stocks this year, he'd call them ugly losers. Growth stocks on the other, in particular the "FANG" names, have been been extremely rewarding to investors. Netflix is up 110% this year, Amazon is up 95%, Google is up 35% and Facebook is up 32%. What's so impressive about the way these stocks are performing is that they're doing it in a low energy market.
“You don't have to burn books to destroy a culture. Just get people to stop reading them.” Ray Bradbury Below is the list of all the books seen in the chart, as well as a few more that I just couldn't fit. I'm sure I left a few out, but if you're looking for some books on investing, this is a pretty good place to start. [link] Reminiscences of a Stock Operator - Edwin LeFevre, 1923 Security Analysis - Benjamin Graham, David Dodd, 1934 Where Are the Customers Yachts?
We organize all of the trending information in your field so you don't have to. Join 36,000+ users and stay up to date on the latest articles your peers are reading.
You know about us, now we want to get to know you!
Let's personalize your content
Let's get even more personalized
We recognize your account from another site in our network, please click 'Send Email' below to continue with verifying your account and setting a password.


Let's personalize your content