This site uses cookies to improve your experience. To help us insure we adhere to various privacy regulations, please select your country/region of residence. If you do not select a country, we will assume you are from the United States. Select your Cookie Settings or view our Privacy Policy and Terms of Use.
Cookie Settings
Cookies and similar technologies are used on this website for proper function of the website, for tracking performance analytics and for marketing purposes. We and some of our third-party providers may use cookie data for various purposes. Please review the cookie settings below and choose your preference.
Used for the proper function of the website
Used for monitoring website traffic and interactions
Cookie Settings
Cookies and similar technologies are used on this website for proper function of the website, for tracking performance analytics and for marketing purposes. We and some of our third-party providers may use cookie data for various purposes. Please review the cookie settings below and choose your preference.
Strictly Necessary: Used for the proper function of the website
Performance/Analytics: Used for monitoring website traffic and interactions
Confused about where we are today? A favorite exercise is to go back to first principles to consider how we got to where we are. (That is a favorite way to find fresh insights). On the equity side, you have to go back a century or so. Equities were considered speculative endeavors, best suited for gamblers and punters. The exceptions? A handful of “Widows & Orphan” stocks, like Ma Bell, some railroads, utilities and the rare bank that was not suffering regular runs.
Altos reports that active single-family inventory was up 2.5% week-over-week. Inventory bottomed in mid-February this year, as opposed to mid-April in 2023, and inventory is now up 12.6% from the February bottom. Click on graph for larger image. This inventory graph is courtesy of Altos Research. As of April 26th, inventory was at 556 thousand (7-day average), compared to 543 thousand the prior week.
Top clicks this week You likely don't need a long-term bond fund. (wsj.com) Allan Sloan, "Don’t fall in love with your money fund." (barrons.com) Good luck trying to dial risk up and down at the right times. (collabfund.com) At what age do we say people are 'old'? (scienceblog.com) What are to make of the big, and persistent, valuation disparities between large and small caps.
Your financial statements hold powerful insights—but are you truly paying attention? Many finance professionals focus on the income statement while overlooking key signals hidden in the balance sheet and cash flow statement. Understanding these numbers can unlock smarter decision-making, uncover risks, and drive long-term success. Join David Worrell, accomplished CFO, finance expert, and author, for an engaging, nontraditional take on reading financial statements.
Financial advisors add value for their clients not only by helping them grow their wealth, but also by working with them to create a plan for how to use it. While much of this process may focus on the client's own lifetime planning needs (e.g., helping them develop a retirement income plan), it often also addresses the client's goals for their wealth after their death.
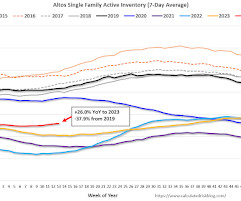
Altos reports that active single-family inventory was down 0.9% week-over-week. Inventory bottomed in mid-February this year, as opposed to mid-April in 2023, and inventory is now up 3.8% from the February bottom. Note: the decline this week was due to the Easter holiday, and seasonally, inventory usually increases following Easter. Click on graph for larger image.
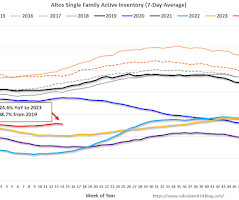
Altos reports that active single-family inventory was up 0.9% week-over-week. Inventory bottomed in mid-February this year, as opposed to mid-April in 2023, and inventory is now up 4.7% from the February bottom. Click on graph for larger image. This inventory graph is courtesy of Altos Research. As of March 29th, inventory was at 517 thousand (7-day average), compared to 513 thousand the prior week.
327
327
Sign up to get articles personalized to your interests!
Financial Advisor Source brings together the best content for financial advisor professionals from the widest variety of industry thought leaders.
Altos reports that active single-family inventory was up 0.9% week-over-week. Inventory bottomed in mid-February this year, as opposed to mid-April in 2023, and inventory is now up 4.7% from the February bottom. Click on graph for larger image. This inventory graph is courtesy of Altos Research. As of March 29th, inventory was at 517 thousand (7-day average), compared to 513 thousand the prior week.
The BEA released the Personal Income and Outlays report for March: Personal income increased $122.0 billion (0.5 percent at a monthly rate) in March , according to estimates released today by the Bureau of Economic Analysis. Disposable personal income (DPI), personal income less personal current taxes, increased $104.0 billion (0.5 percent) and personal consumption expenditures (PCE) increased $160.9 billion (0.8 percent).
Here are a few measures of inflation: The first graph is the one Fed Chair Powell had mentioned when services less rent of shelter was up around 8% year-over-year. This declined, but has turned up recently, and is now up 4.8% YoY. Click on graph for larger image. This graph shows the YoY price change for Services and Services less rent of shelter through March 2024.
From the MBA: Mortgage Applications Decrease in Latest MBA Weekly Survey Mortgage applications decreased 0.6 percent from one week earlier, according to data from the Mortgage Bankers Association’s (MBA) Weekly Mortgage Applications Survey for the week ending March 29, 2024. The Market Composite Index, a measure of mortgage loan application volume, decreased 0.6 percent on a seasonally adjusted basis from one week earlier.
S&P/Case-Shiller released the monthly Home Price Indices for February ("February" is a 3-month average of December, January and February closing prices). This release includes prices for 20 individual cities, two composite indices (for 10 cities and 20 cities) and the monthly National index. From S&P S&P CoreLogic Case-Shiller Index’s Upward Trend Persists in February 2024 The S&P CoreLogic Case-Shiller U.S.
As businesses increasingly adopt automation, finance leaders must navigate the delicate balance between technology and human expertise. This webinar explores the critical role of human oversight in accounts payable (AP) automation and how a people-centric approach can drive better financial performance. Join us for an insightful discussion on how integrating human expertise into automated workflows enhances decision-making, reduces fraud risks, strengthens vendor relationships, and accelerates R
Here is a graph of the year-over-year change in shelter from the CPI report and housing from the PCE report this morning, both through March 2024. CPI Shelter was up 5.6% year-over-year in March, down from 5.8% in February, and down from the cycle peak of 8.2% in March 2023. Housing (PCE) was up 5.8% YoY in March , down slightly from 5.8% in January, and down from the cycle peak of 8.3% in April 2023.
From the Census Bureau reported that overall construction spending increased: Construction spending during February 2024 was estimated at a seasonally adjusted annual rate of $2,091.5 billion, 0.3 percent below the revised January estimate of $2,096.9 billion. The February figure is 10.7 percent above the February 2023 estimate of $1,889.6 billion emphasis added Private spending was unchanged and public spending decreased: Spending on private construction was at a seasonally adjusted annual rate
Altos reports that active single-family inventory was up 2.6% week-over-week. Inventory bottomed in mid-February this year, as opposed to mid-April in 2023, and inventory is now up 5.6% from the February bottom. Click on graph for larger image. This inventory graph is courtesy of Altos Research. As of April 12th, inventory was at 526 thousand (7-day average), compared to 513 thousand the prior week.
The headline jobs number in the March employment report was above expectations; and January and February payrolls were revised up by 22,000 combined. The participation rate and the employment population ratio both increased, and the unemployment rate decreased to 3.8%. Leisure and hospitality gained 49 thousand jobs in March and is now above pre-pandemic levels.
Based off SkyStem's popular e-Book, the book of secrets to the month-end close will be revealed in this one-hour webinar. Learn leading practices when it comes to building a strong and sustainable month-end close that has room to grow and evolve. Learn about the power of precise estimates, why reconciliations are critical to closing the books, how and when to automate, and how the chart of accounts play into your close process.
From the MBA: Mortgage Applications Decrease in Latest MBA Weekly Survey Mortgage applications decreased 2.7 percent from one week earlier, according to data from the Mortgage Bankers Association’s (MBA) Weekly Mortgage Applications Survey for the week ending April 19, 2024. The Market Composite Index, a measure of mortgage loan application volume, decreased 2.7 percent on a seasonally adjusted basis from one week earlier.
From the BLS : Total nonfarm payroll employment rose by 303,000 in March, and the unemployment rate changed little at 3.8 percent , the U.S. Bureau of Labor Statistics reported today. Job gains occurred in health care, government, and construction. The change in total nonfarm payroll employment for January was revised up by 27,000, from +229,000 to +256,000, and the change for February was revised down by 5,000, from +275,000 to +270,000.
Today, in the Calculated Risk Real Estate Newsletter: Moody's: Apartment Vacancy Rate Unchanged in Q1; Office Vacancy Rate at Record High A brief excerpt: From Moody’s: The office sector slashed its vacancy record set just a quarter ago and marched another 20 bps closer to the 20% mark. Sitting at 19.8% in Q1 2024, this new record high vacancy rate is 50 bps above the recessionary peaks recorded in 1986 and 1991.
Like being inches from the end zone, many advisors are frustratingly close to their next level of success. You work hard. You put in the hours. But if your closing rate is stuck or your pipeline feels like a revolving door… something has to change. Most advisors are just one small shift away from dramatically increasing their revenue. The difference?
Adopting an adaptive approach to retirement planning acknowledges the dynamic nature of spending patterns and emphasizes flexibility in financial strategies.
The DOL reported : In the week ending April 6, the advance figure for seasonally adjusted initial claims was 211,000 , a decrease of 11,000 from the previous week's revised level. The previous week's level was revised up by 1,000 from 221,000 to 222,000. The 4-week moving average was 214,250, a decrease of 250 from the previous week's revised average.
From the MBA: Mortgage Applications Increase in Latest MBA Weekly Survey Mortgage applications increased 3.3 percent from one week earlier, according to data from the Mortgage Bankers Association’s (MBA) Weekly Mortgage Applications Survey for the week ending April 12, 2024. The Market Composite Index, a measure of mortgage loan application volume, increased 3.3 percent on a seasonally adjusted basis from one week earlier.
Between book leave and COVID I have been pretty quiet lately. Since it’s been a few months, I thought we could take a quick look at the Federal Reserve Bank of Philadelphia’s State Coincident Indicators out for both January and February 2024.1 As the charts above show, the economy on a state-by-state basis has markedly improved from Q4 2023’s softening.
Managing spend is more than a cost cutting exercise – it's a pathway to smarter decisions that unlock efficiency and drive growth. By understanding and refining the spending process, financial leaders can empower their organizations to achieve more with less. Explore the art of balancing financial control with operational growth. From uncovering hidden inefficiencies to designing workflows that scale your business, we’ll share strategies to align your organization’s spending with its strategic g
From the Association of American Railroads (AAR) Rail Time Indicators. Graphs and excerpts reprinted with permission. Total originated carloads on U.S. railroads fell 3.5% (31,101 carloads) in March 2024 from March 2023, their third straight monthly decline. Total carloads averaged 216,716 per week in March 2024, the fewest for any March in our records that begin in January 1988.
Also on the site Some interesting developments in the financial media space. (abnormalreturns.com) Top clicks this week These 15 stocks destroyed the most value in the past decade. (morningstar.com) It's way too easy to mislead someone with charts. (awealthofcommonsense.com) Two things you probably don't need to worry about, including index concentration.
Also on the site Better investors make fewer decisions. (abnormalreturns.com) Top clicks this week Two stocks accounted for a third of the Russell 2000's 5.2% return in Q1. (wsj.com) How major asset classes performed in March 2024. (capitalspectator.com) How to choose among total stock market ETFs. (humbledollar.com) Hyundai and Kia are crushing it in the U.S.
Join this insightful webinar with industry expert Abdi Ali, who will discuss the challenges that can arise from managing lease accounting with spreadsheets! He will share real-world examples of errors, compliance issues, and risks that may be present within your spreadsheets. Learn how these tools, while useful, can sometimes lead to inefficiencies that affect your time, resources, and peace of mind.
At the Calculated Risk Real Estate Newsletter this week: • Moody's: Apartment Vacancy Rate Unchanged in Q1; Office Vacancy Rate at Record High • Freddie Mac House Price Index Increased in February; Up 5.9% Year-over-year • ICE Mortgage Monitor: The Impact of "Golden-Handcuffs" on Mortgage Payments • Asking Rents Mostly Unchanged Year-over-year • Immigration and Household Formation This is usually published 4 to 6 times a week and provides more in-depth analysis of the housing market.
From Dodge Data Analytics: Dodge Momentum Index Fell 9% in March The Dodge Momentum Index (DMI), issued by Dodge Construction Network, fell 8.6% in March to 164.0 (2000=100) from the revised February reading of 179.5. Over the month, commercial planning fell 3.2% and institutional planning dropped 17.2%. “In 2023, commercial planning decreased while institutional planning notably improved, sitting 29% above year-ago levels in February 2024.
Michael Tiedemann talks about taking two companies public via SPAC, raising capital and what he and his partners are building at AlTi Tiedemann Global.
Speaker: Duke Heninger, Partner and Fractional CFO at Ampleo & Creator of CFO System
Are you ready to elevate your accounting processes for 2025? 🚀 Join us for an exclusive webinar led by Duke Heninger, a seasoned fractional CFO and CPA passionate about transforming back-office operations for finance teams. This session will cover critical best practices and process improvements tailored specifically for accounting professionals.
We organize all of the trending information in your field so you don't have to. Join 36,000+ users and stay up to date on the latest articles your peers are reading.
You know about us, now we want to get to know you!
Let's personalize your content
Let's get even more personalized
We recognize your account from another site in our network, please click 'Send Email' below to continue with verifying your account and setting a password.


Let's personalize your content